Protected: Improving the Veteran experience with seamless API data
Experimenting rapidly on a new meditation app for busy people
Project overview
Problem
Our team was asked to create a digital product that helps people achieve better mental health during the COVID-19 pandemic and beyond. We targeted self-described “busy people” with the prevailing mindset being “if it’s not on my calendar, it’s not going to happen.”
Method
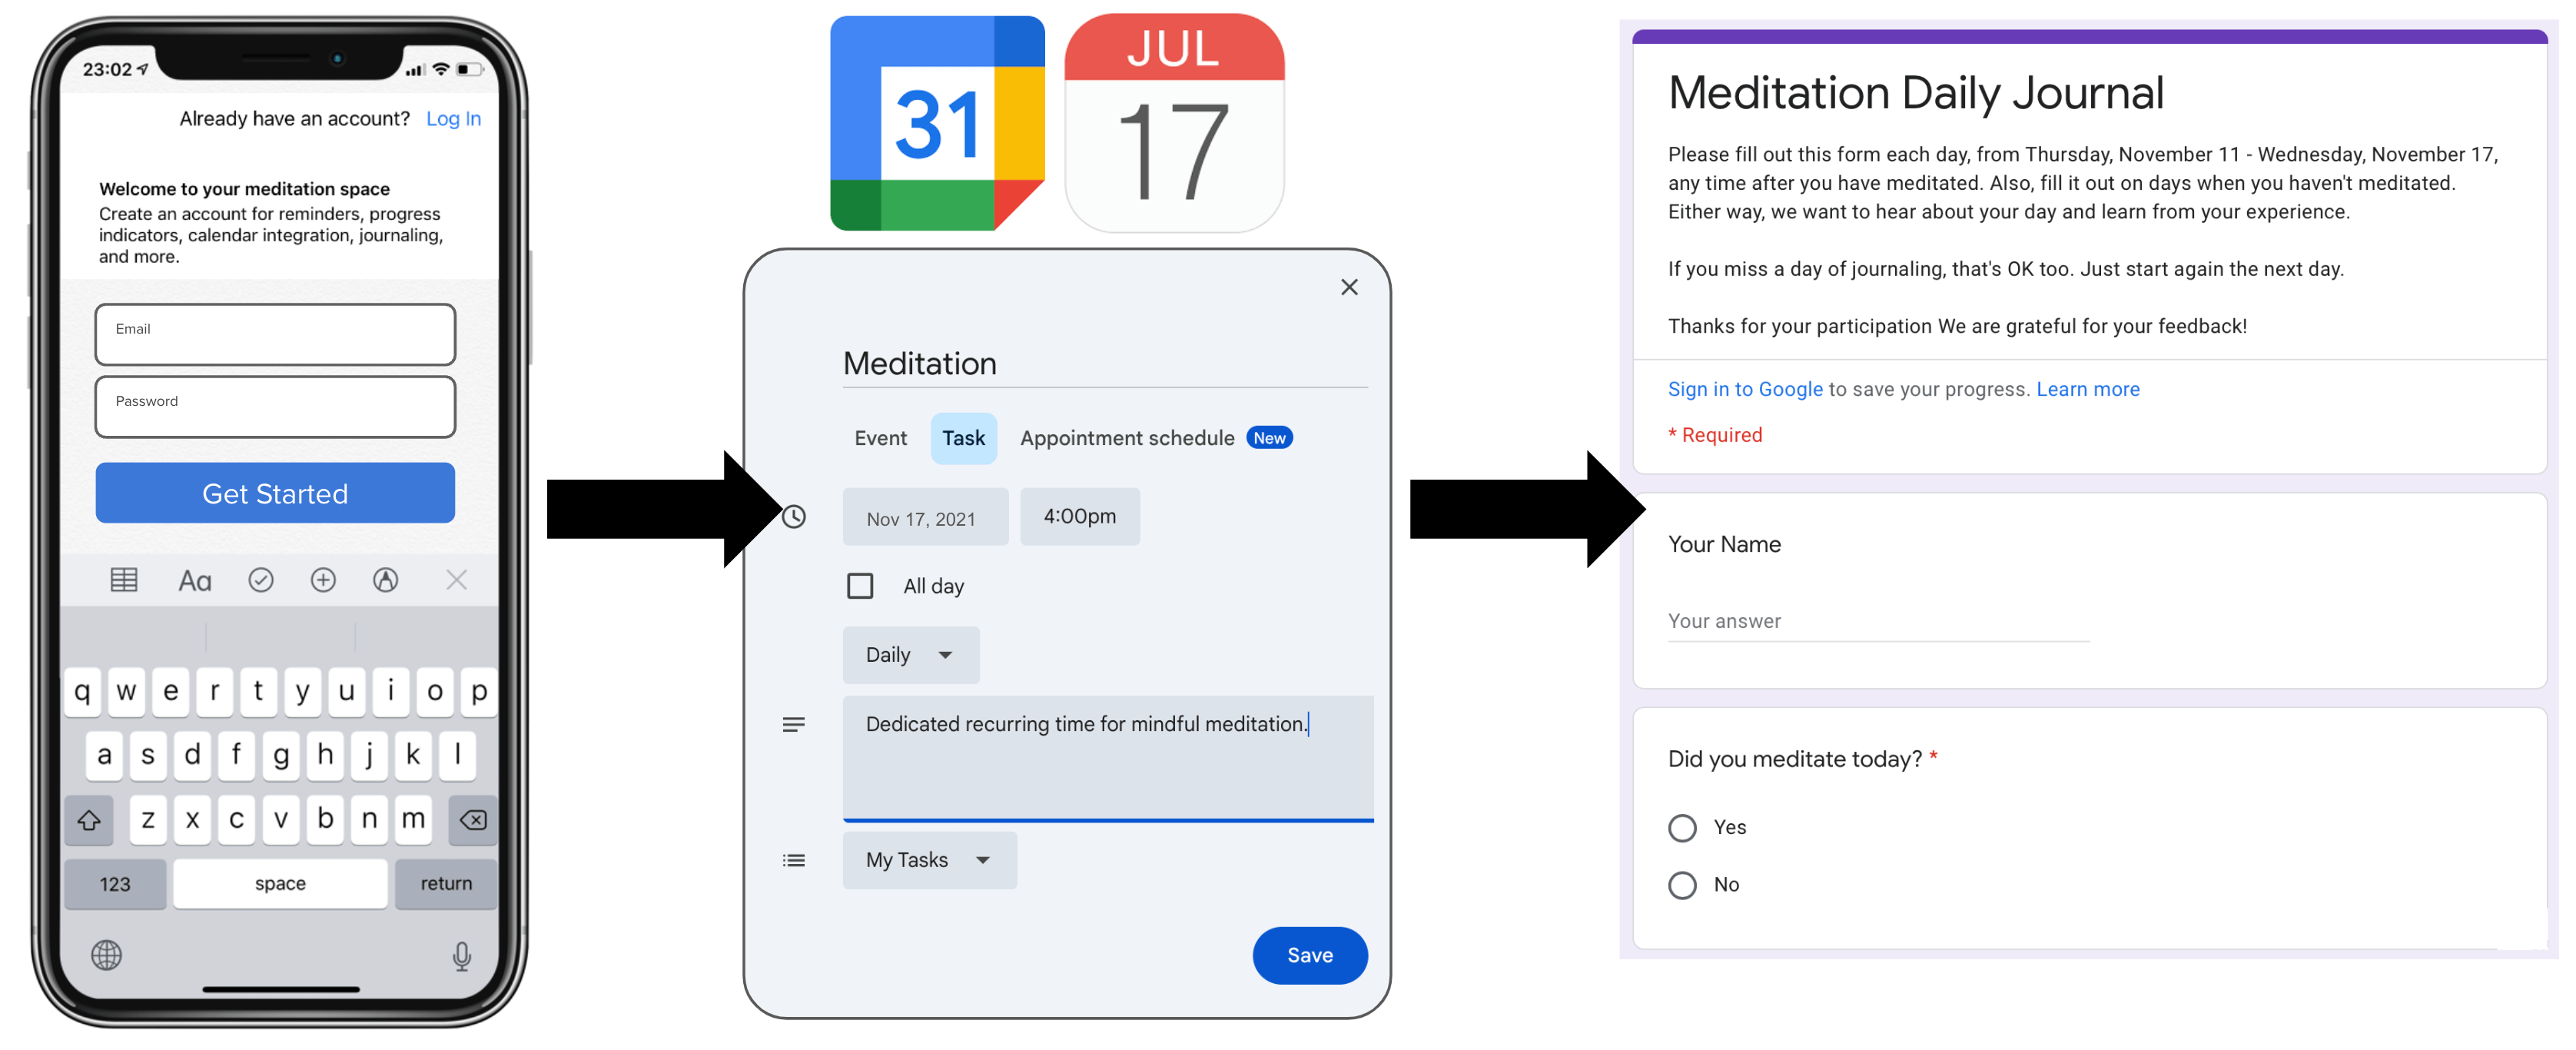
The project lasted six weeks and included three research phases. First, we used remote moderated interviews to uncover several obstacles for establishing the habit of mindful meditation. Second, we facilitated rapid experimentation using low-fidelity storyboarding concept testing. Third, we facilitated rapid experimentation using concierge test with our high-fidelity prototype meditation app and 7-day diary study (see Figure 1). Throughout the project our team used a variety of tools, including Mural for collaborative planning, Google Forms and Sheets for data collection and analysis, Invision of prototyping, and Zoom for moderated virtual interviews.
Impact
Our team discovered that integrating a calendar sync feature into the meditation app directly improved the user experience, leading to a 9-minute increase in the average meditation time.
My role
As a member of the 5-person team, I participated in all team sessions, including brainstorming, prioritization, planning, facilitation, analysis, and presentations. I facilitated research during the discovery phase (i.e., interviews) and the two rapid experimentation phases (i.e., storyboard concept testing and concierge testing). Additionally, I completed descriptive analysis of the rapid experimentation diary study, including the creation of charts for reporting and presentation.
Process Details
Discovery research
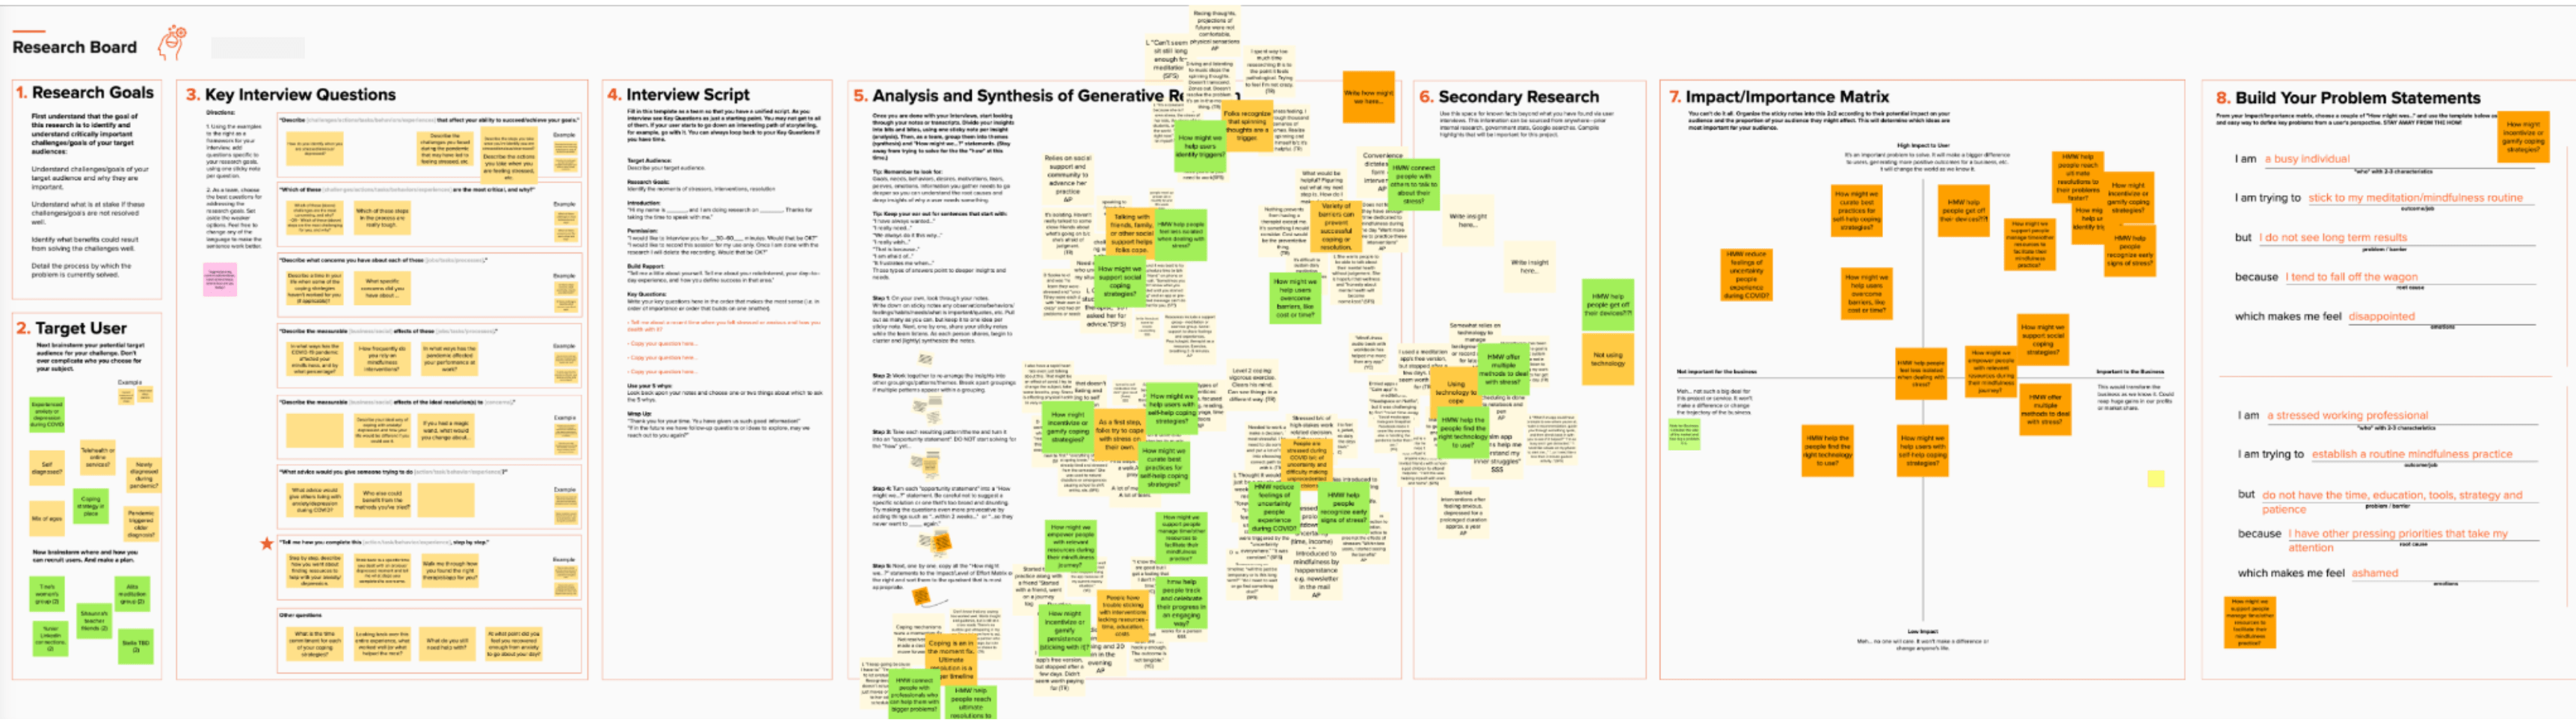
Our team used Mural to plan our discovery research (see Figure 2). First we collaboratively identified our target users and wrote interview questions. 30-minute moderated interviews were conducted with 10 participants and then analyze using affinity mapping, which generated How Might We (HMW) questions. Secondary desk research was used to explore HMWs, such as “HMW help users overcome barriers of time?” A matrix was used to identify the impact and importance of key findings/ideas. Lastly, we used our discovery data to build problem statements that we could use to guide our product thinking and concept development (i.e., I am a busy individual who is trying to stick to my mindfulness routine but I do not see long-term results because I tend to fall off the wagon, which makes me feel disappointed.).
Value stream
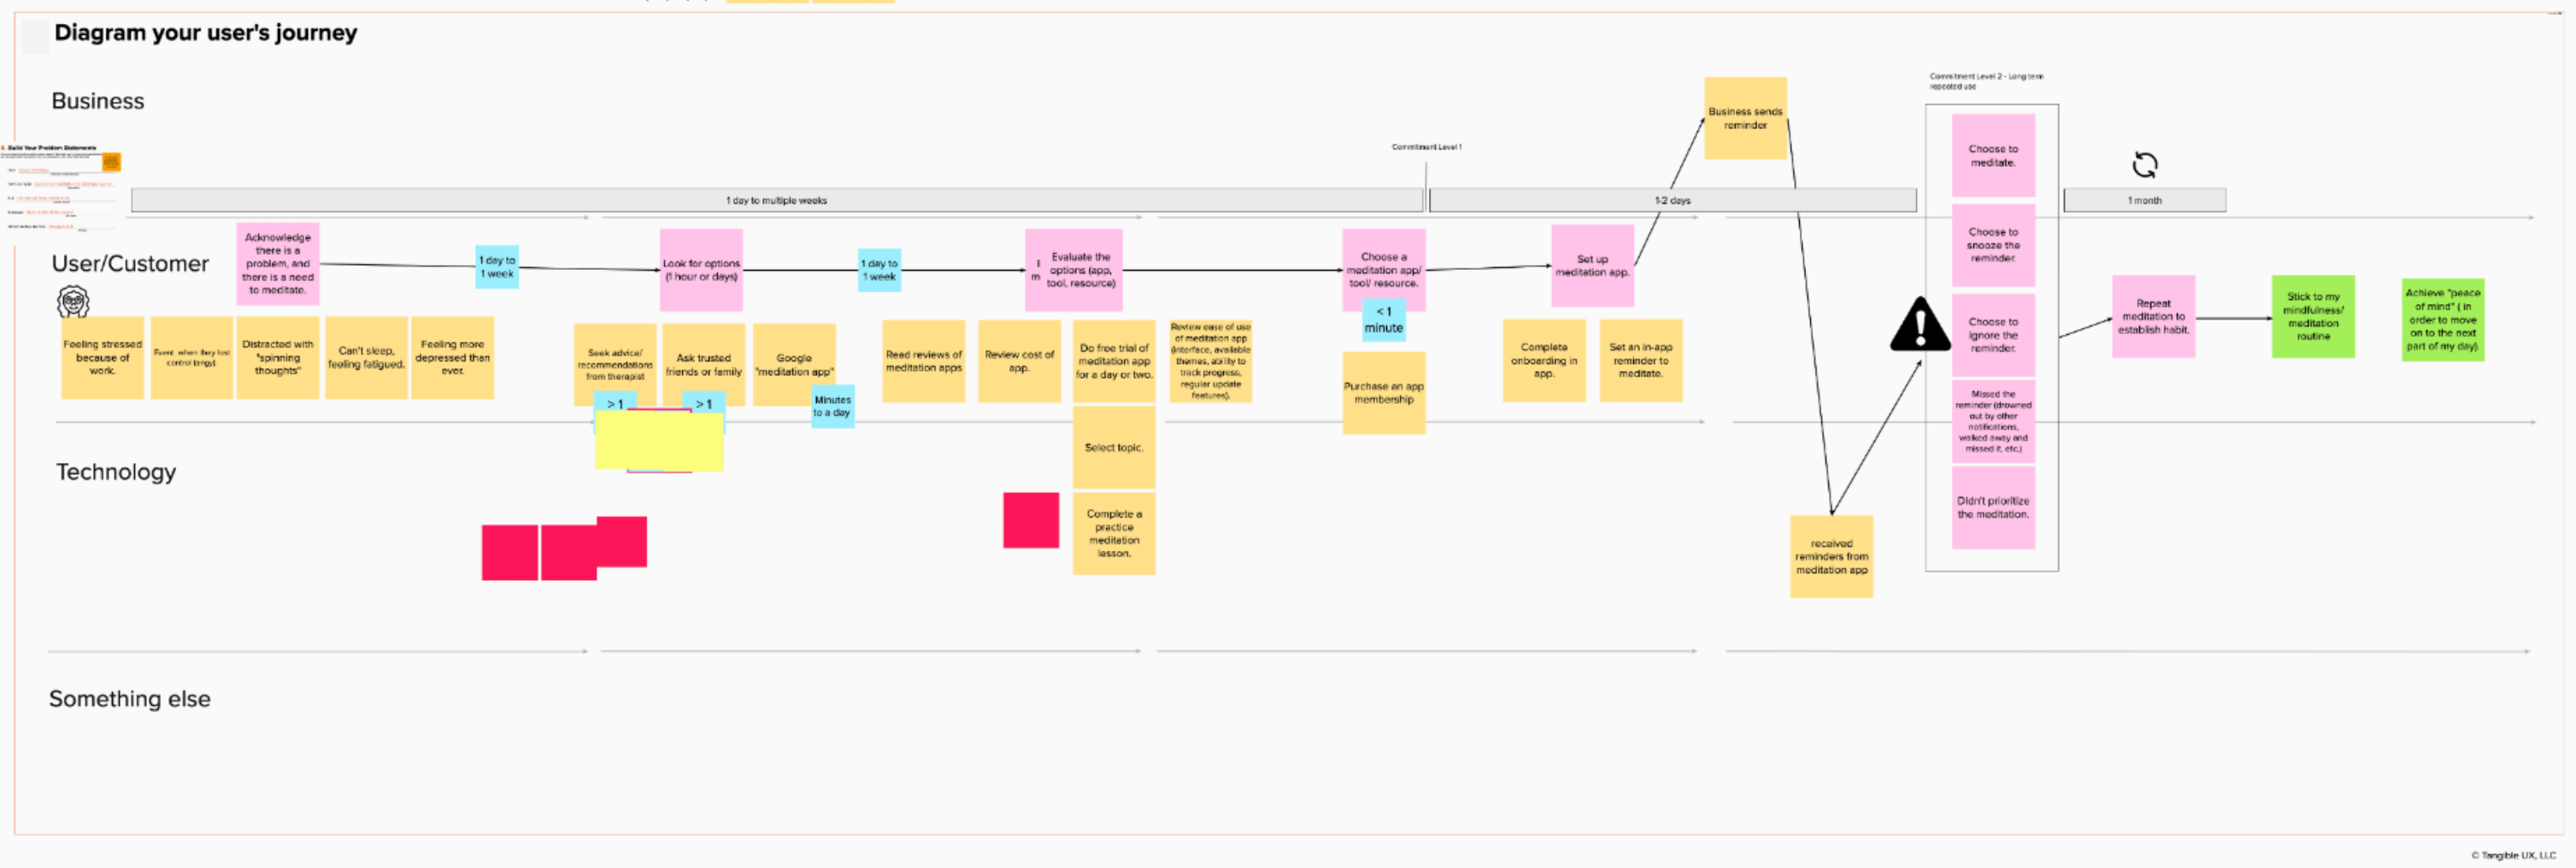
We continued to use Mural to help us translate our discovery research findings into a value-centered user journey diagram that included steps for business actions, user/customer actions, and technology implementation (see Figure 3).
Feature prioritization
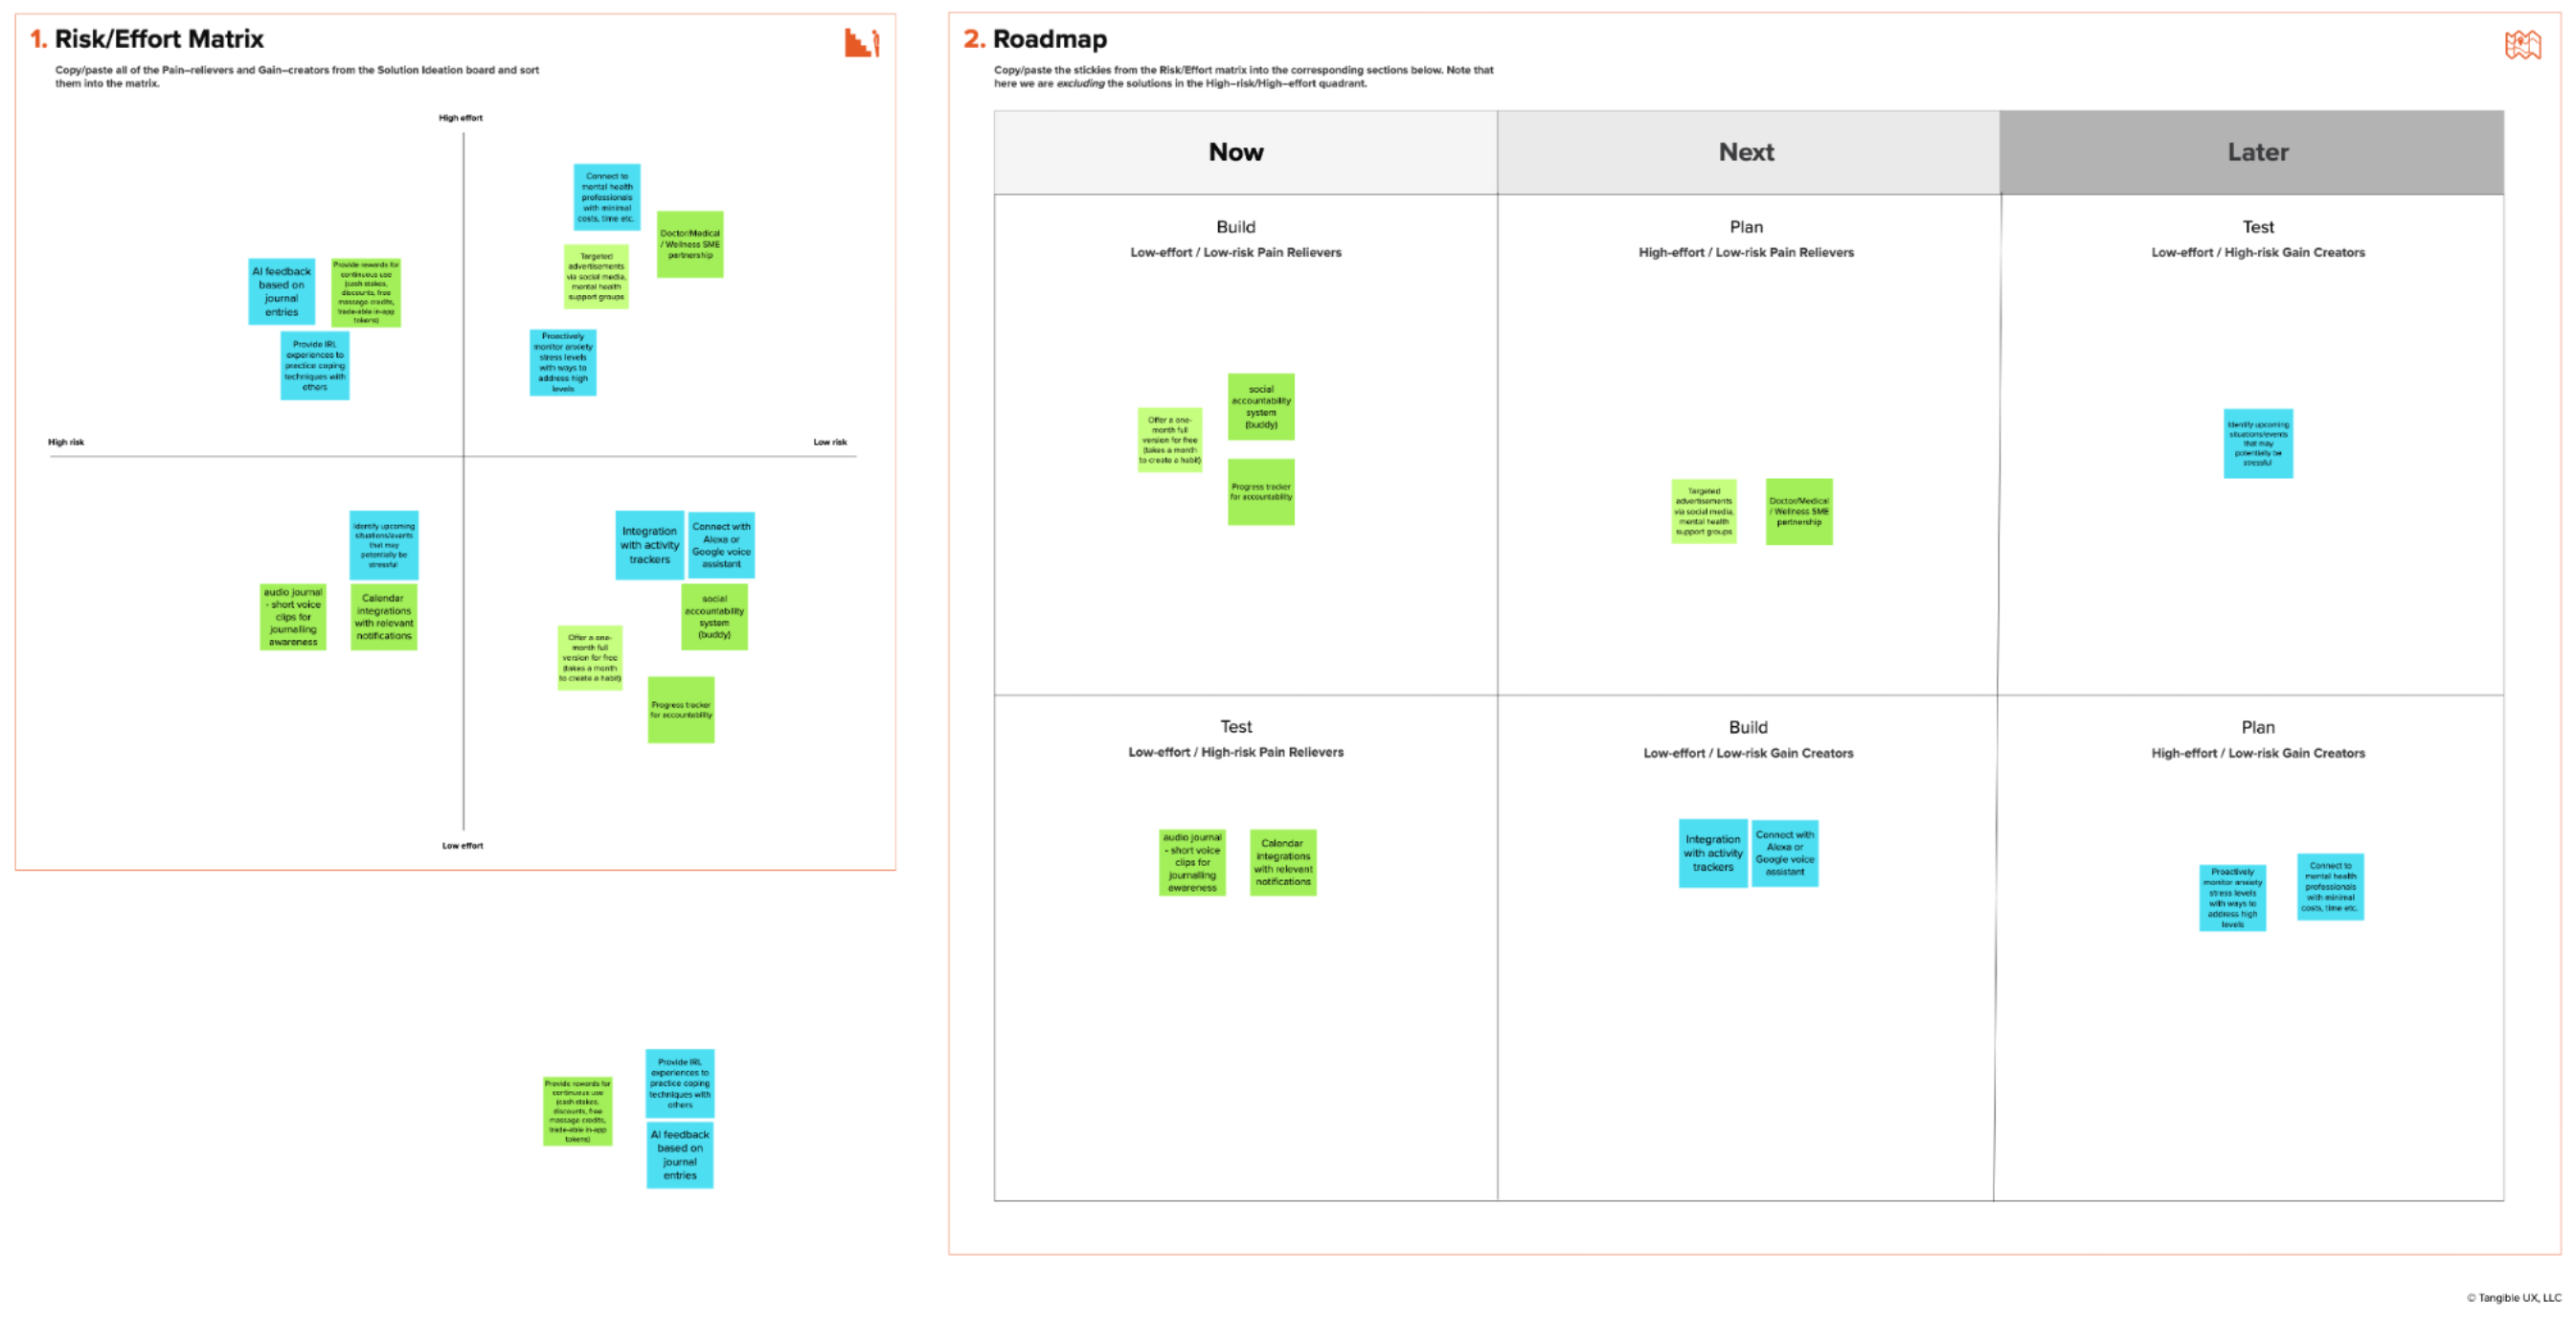
A prioritization matrix in Mural helped us identify the risk and effort for our pain-relievers and gain-creators, which were then prioritized in a roadmap to guide our rapid experiments (see Figure 4).
Rapid experimentation #1 with low-fidelity concept testing
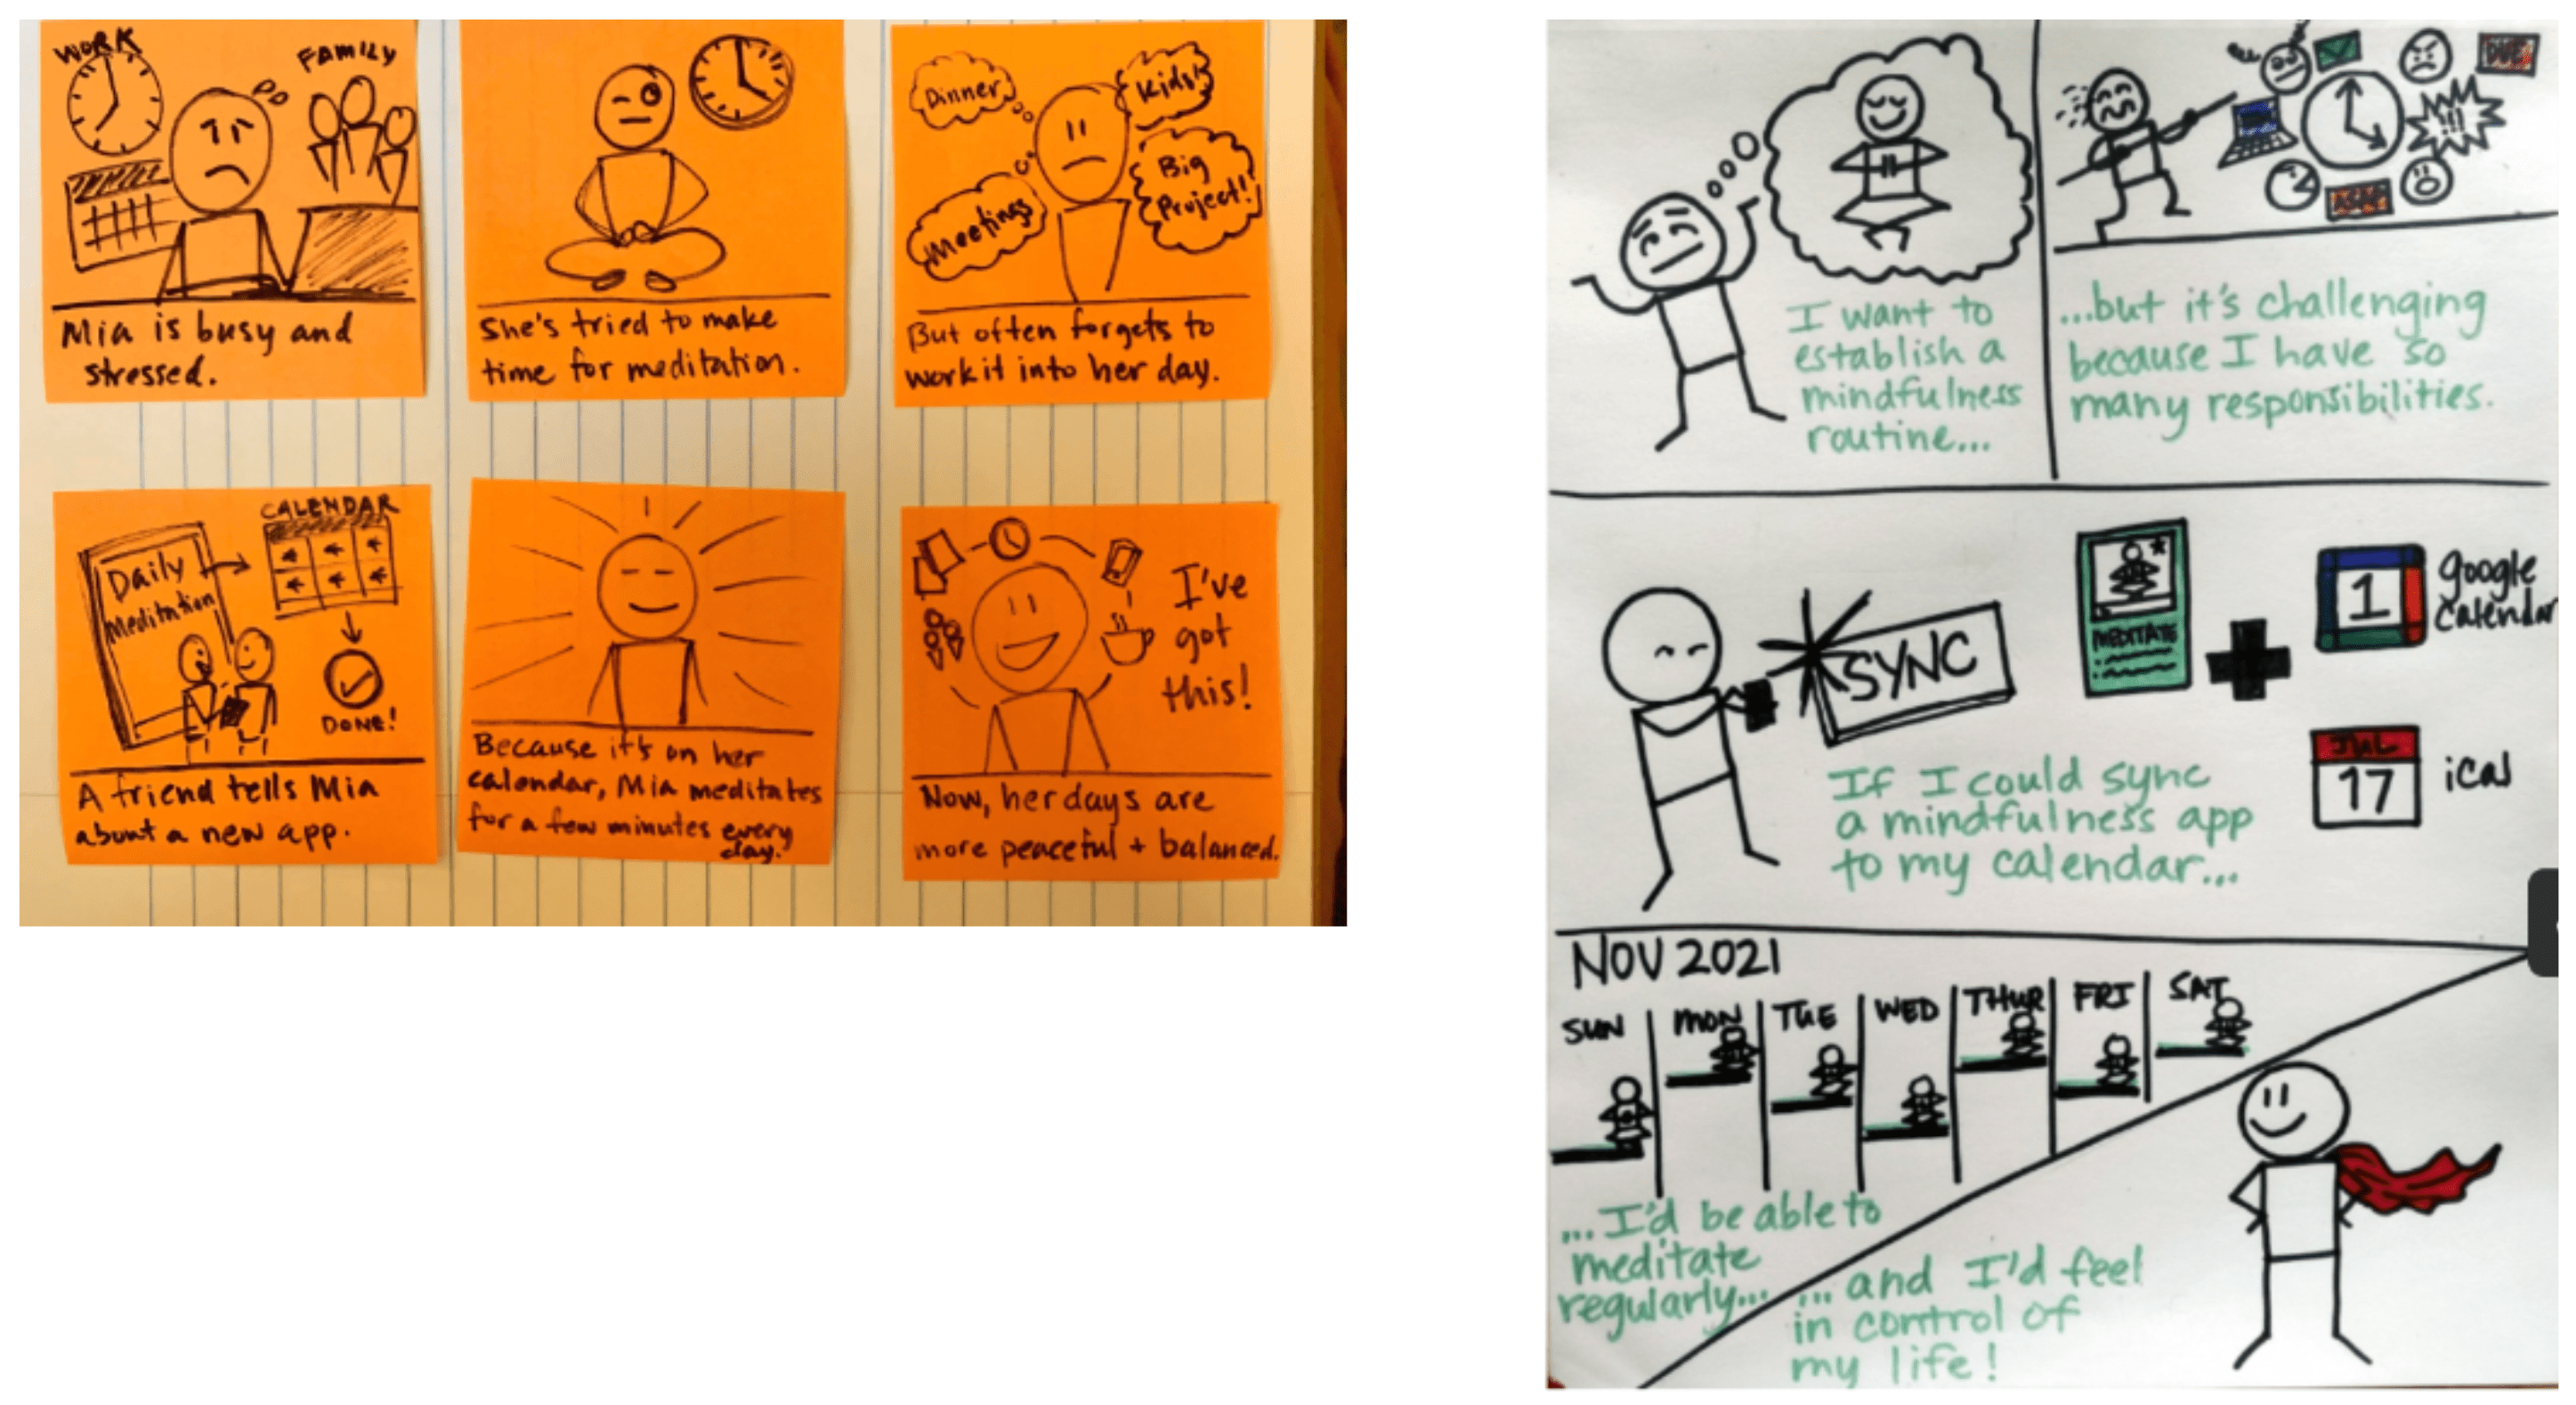
The first rapid experiment included a concept test using moderated interviews with seven participants, including discussion of low-fidelity storyboarding concepts to reduce “preciousness” and increase storytelling (see Figure 5). Questions included comparison ratings about current/past mediation app experiences compared to our low-fidelity storyboard concept.
Rapid experimentation #2 with concierge test, high-fidelity prototype, and diary study
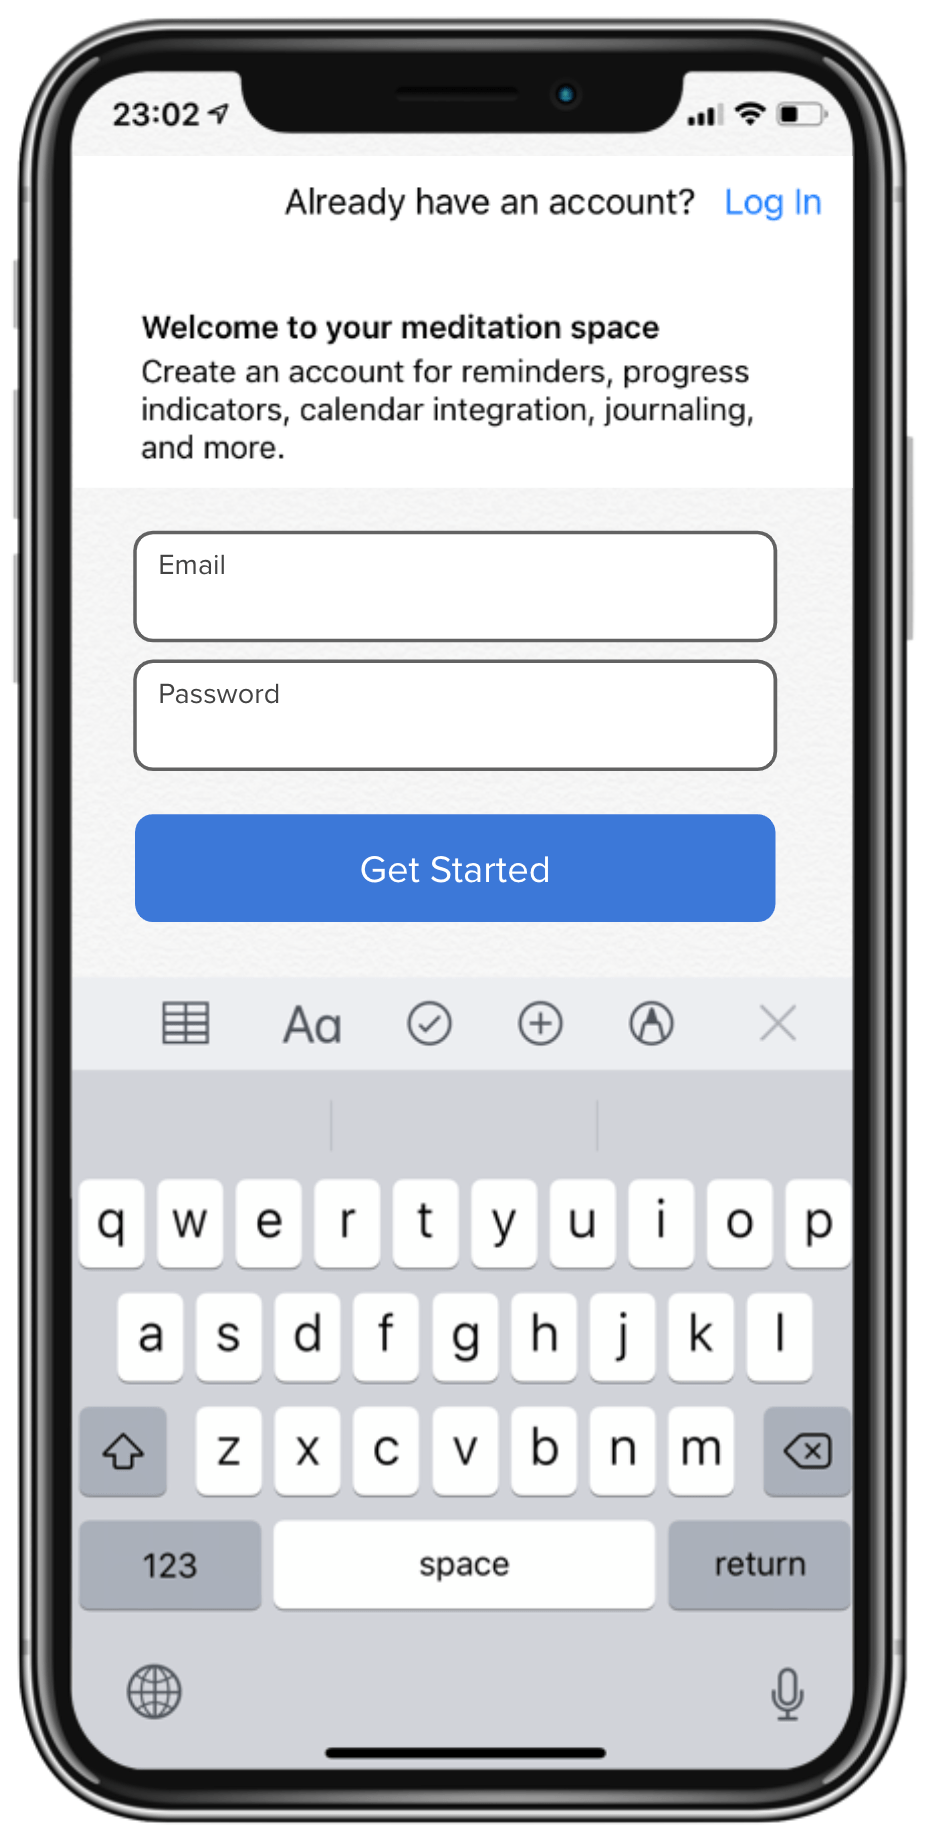
The second rapid experiment used a Concierge Test that included a high-fidelity Invision prototype (see Figure 6) coupled with a behind-the-scenes researcher who created a synched calendar event with the participants’ own calendar based on the choices they made in the high-fidelity prototype. This was immediately followed by a 7-day diary study that used a Google Form.
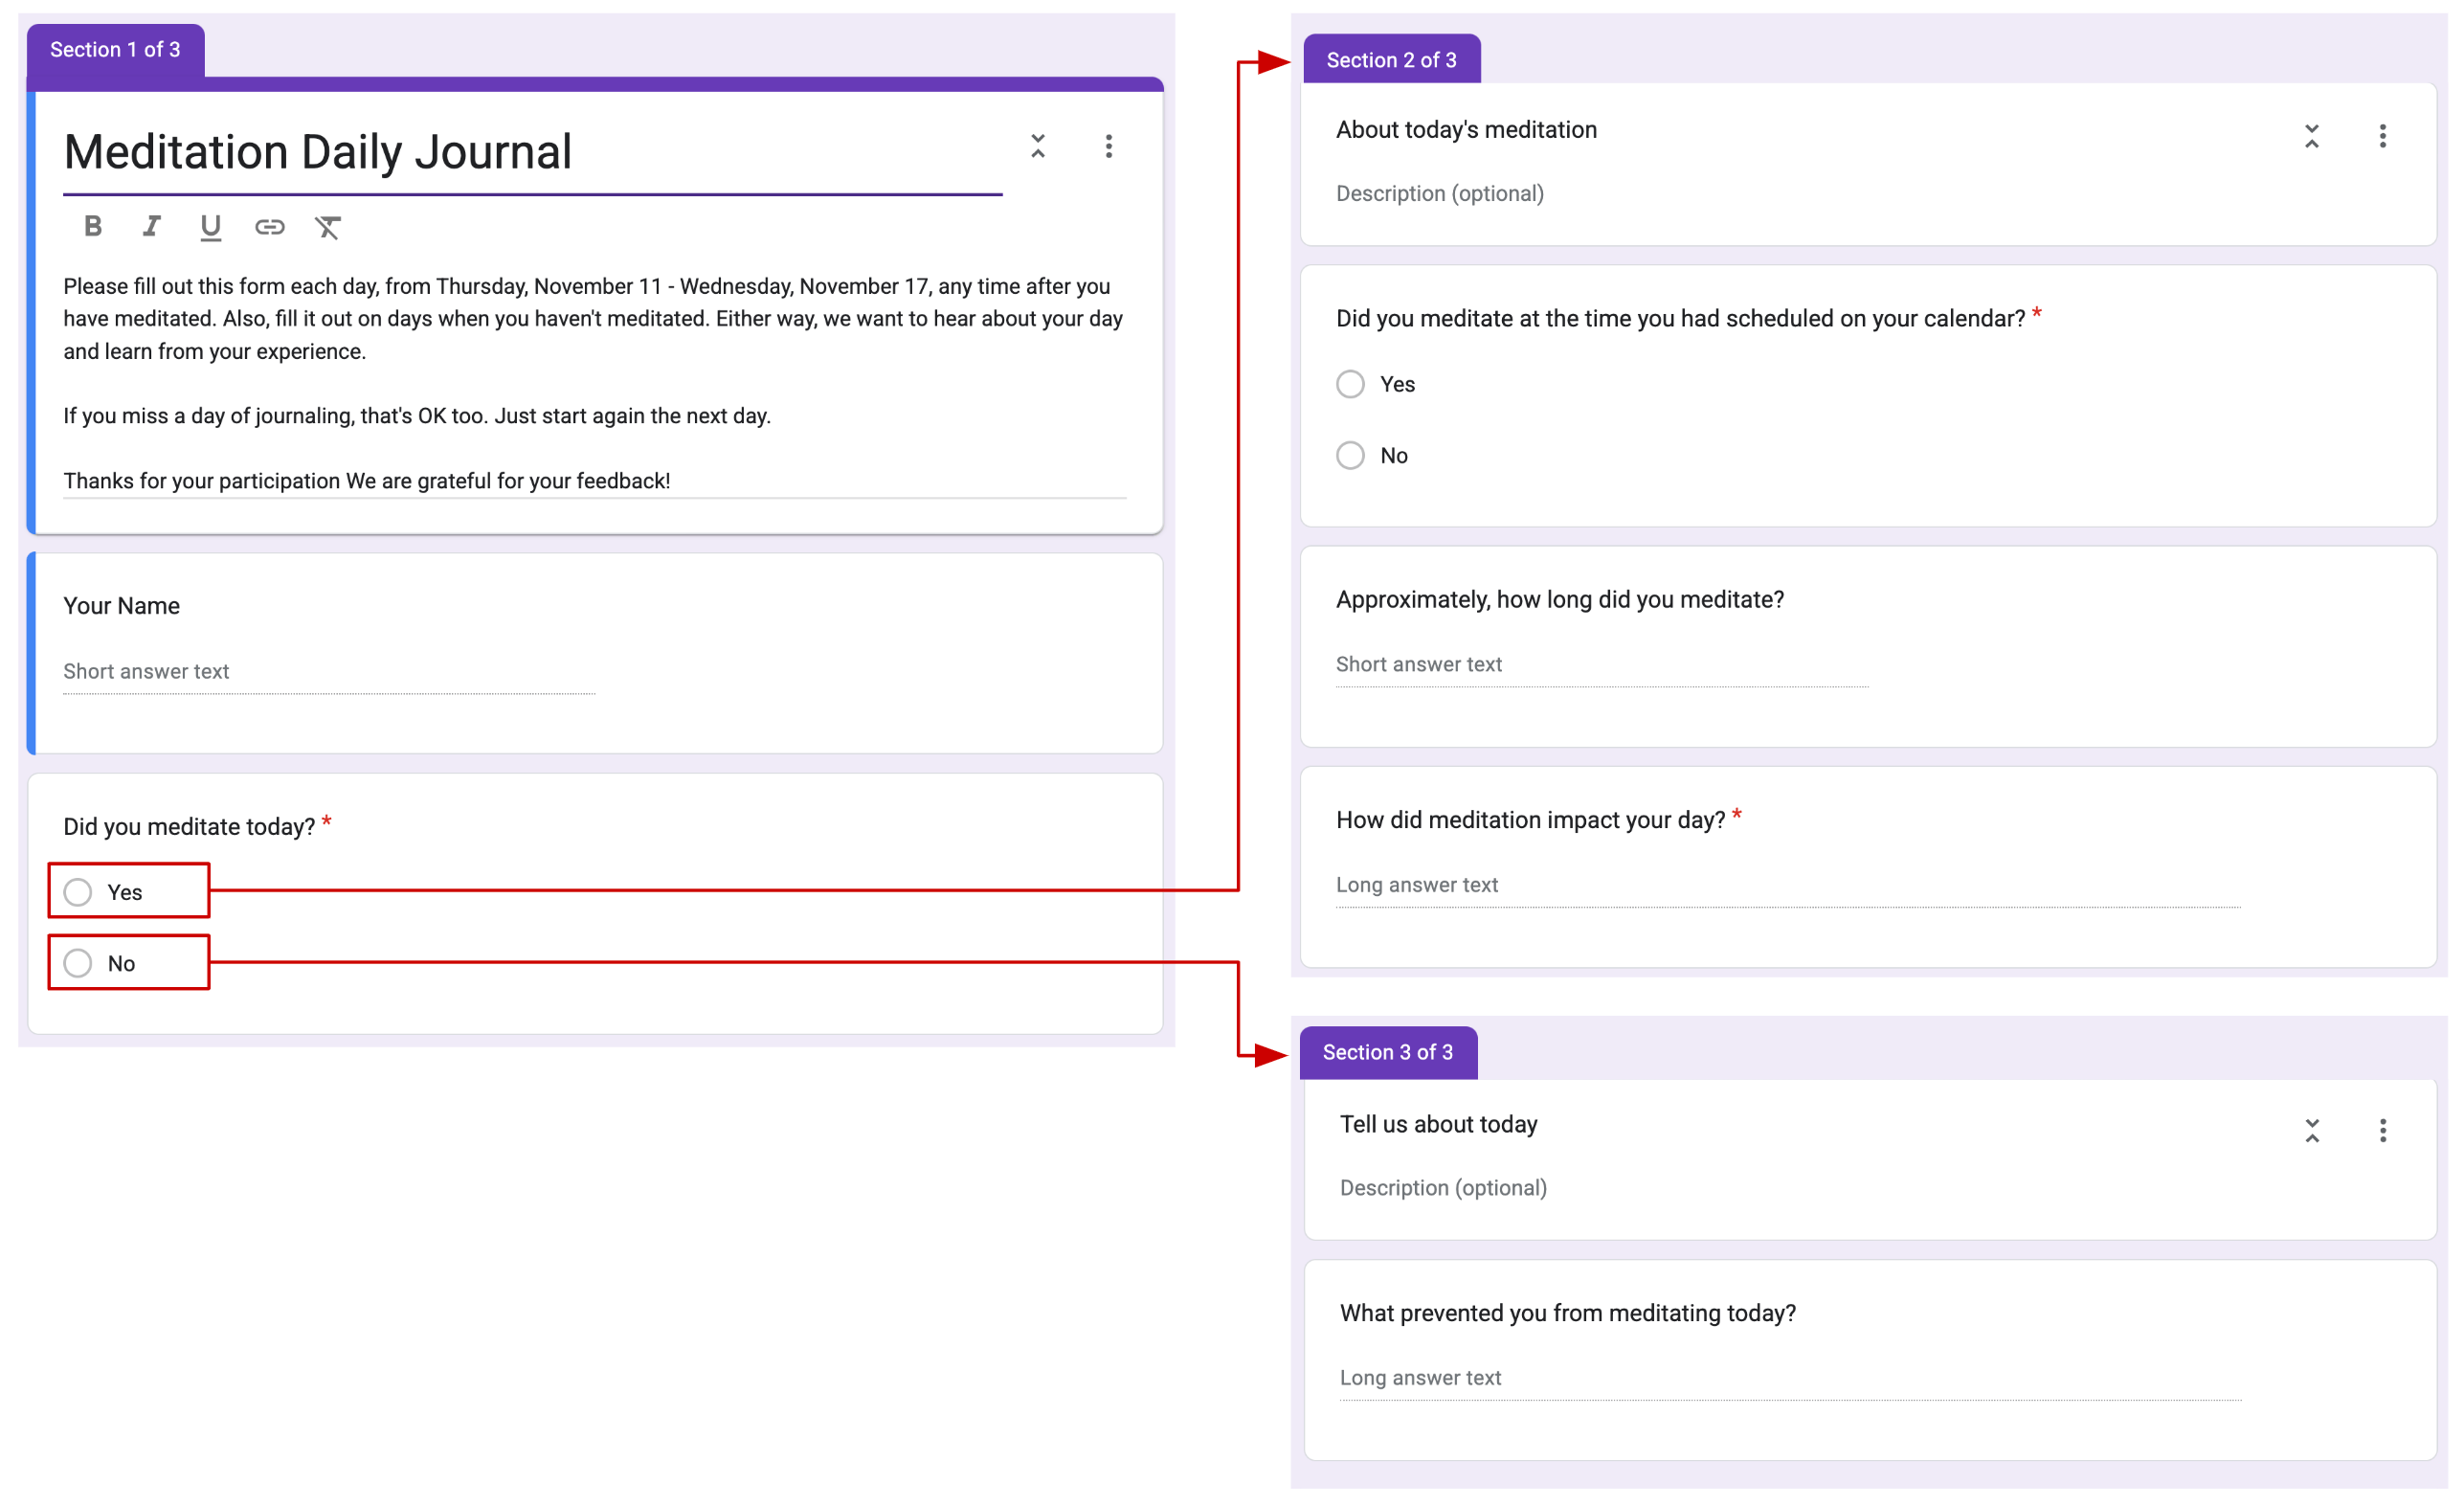
The diary study used a Google Form with conditional logic (see Figure 7). If participants answered “Yes” to the question “Did you meditate today?” the form took them to questions about their completed meditation, including one closed-ended question and three open-ended questions. If participants answered “No” to the question “Did you meditate today?” the form took them to one closed-ended question and one open-ended question so that we could learn a little more about why they did not complete a meditation session that day.
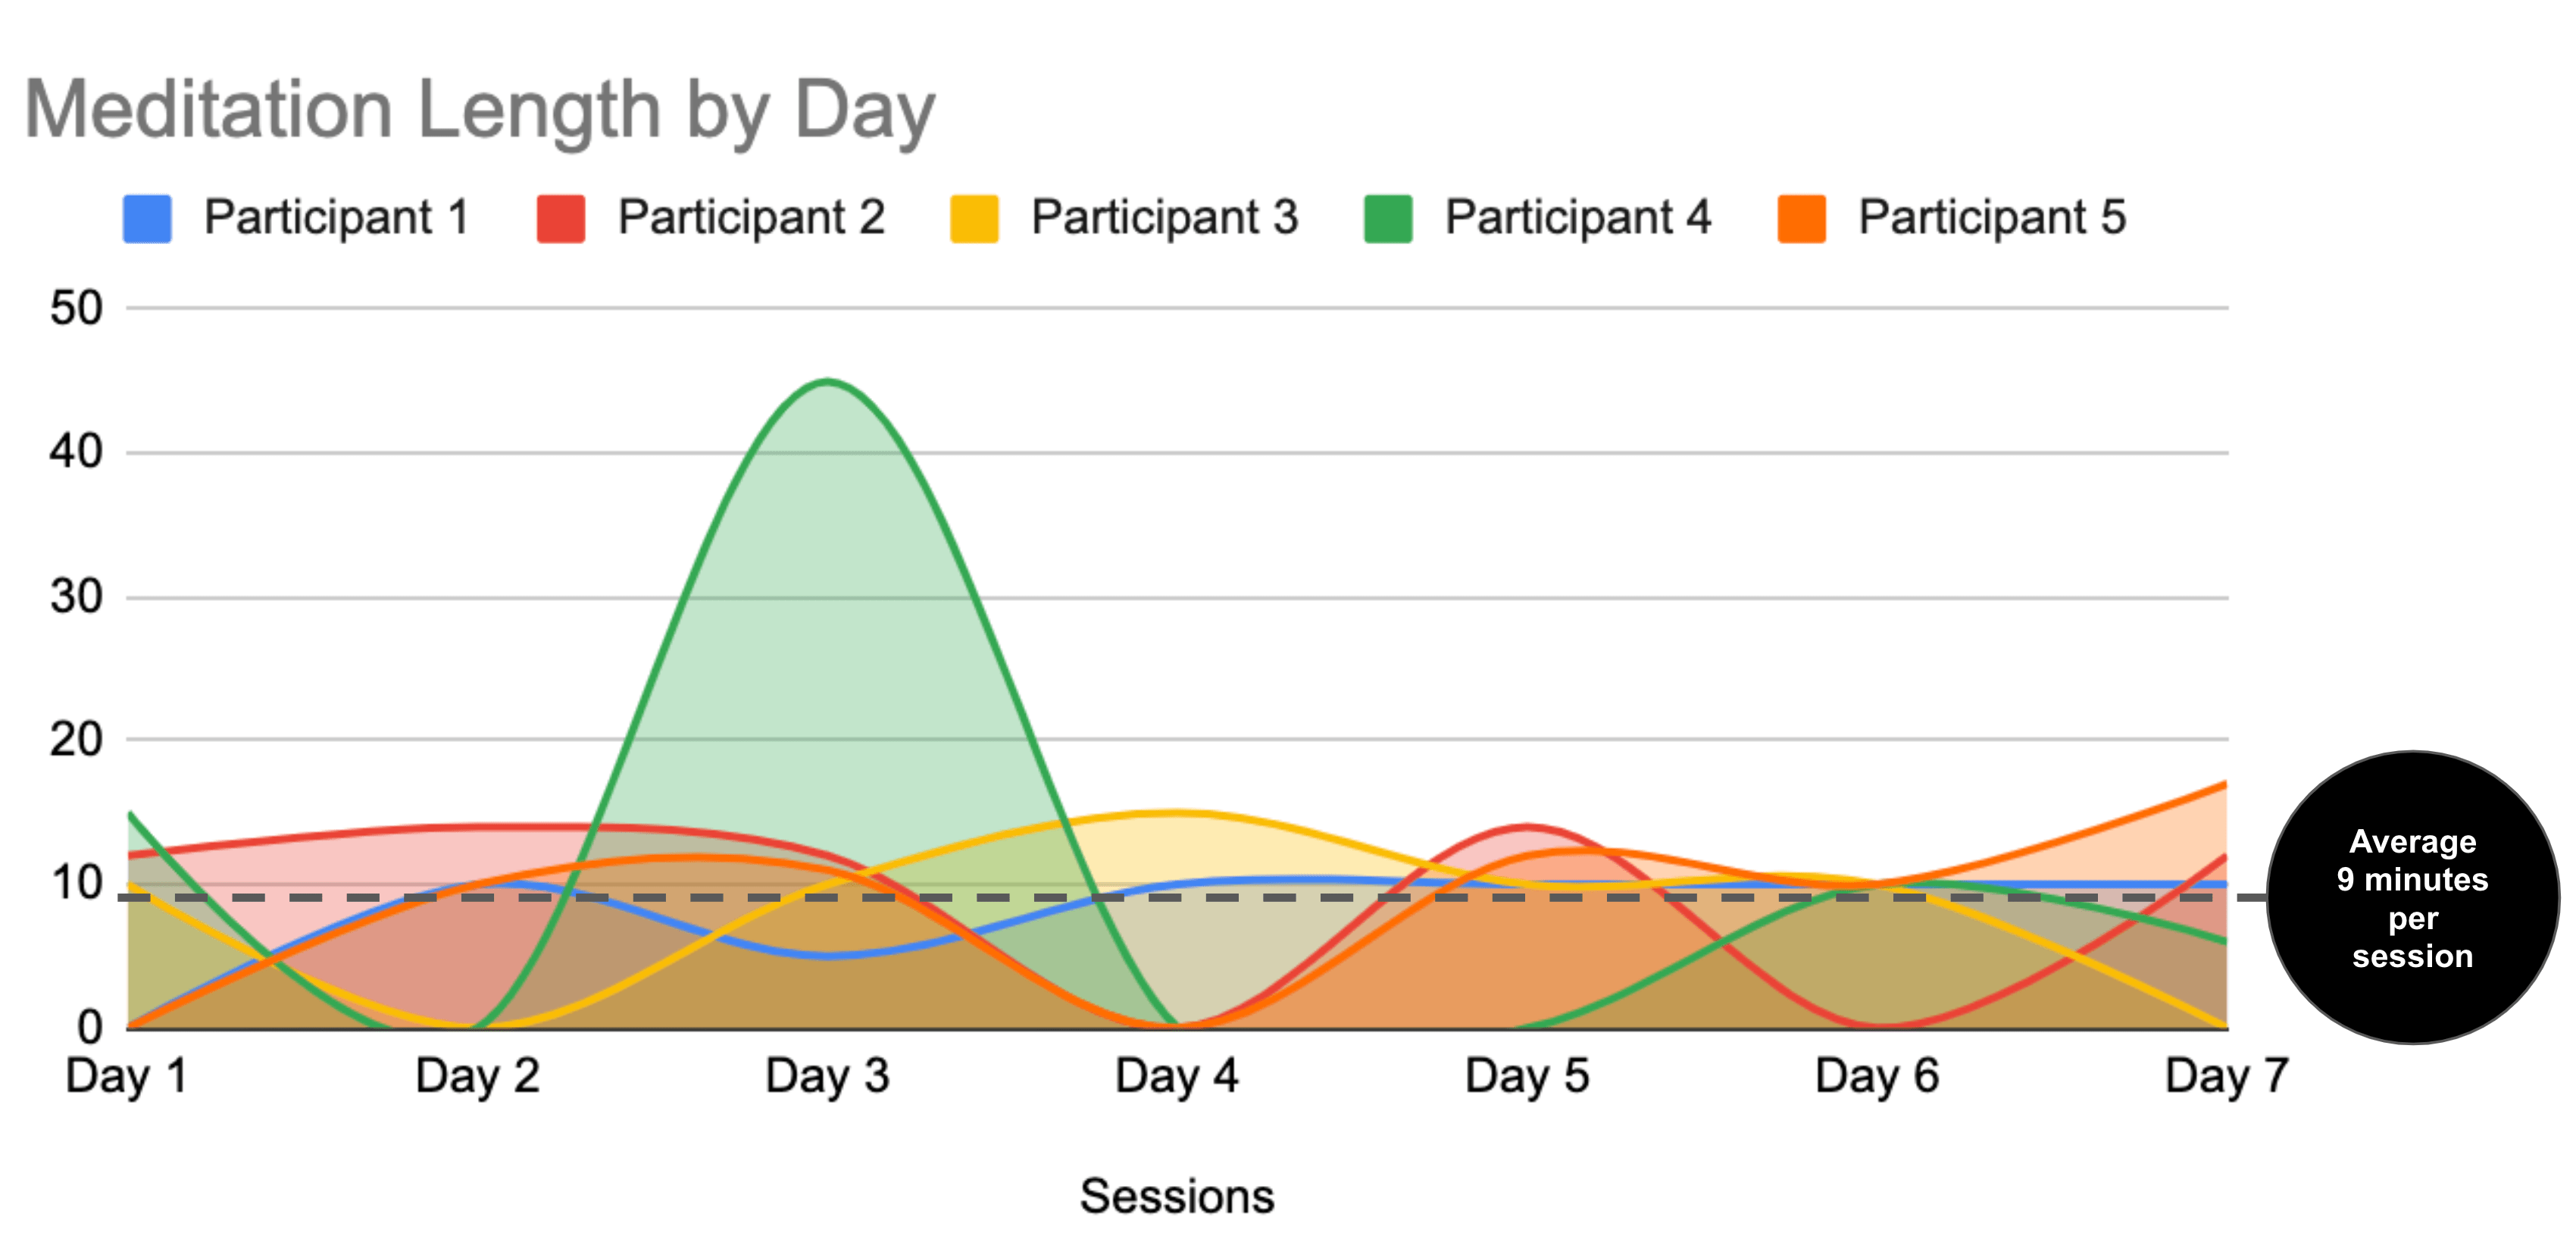
Data from the diary study was analyzed using descriptive statistics in Google Sheets (see Figure 8).
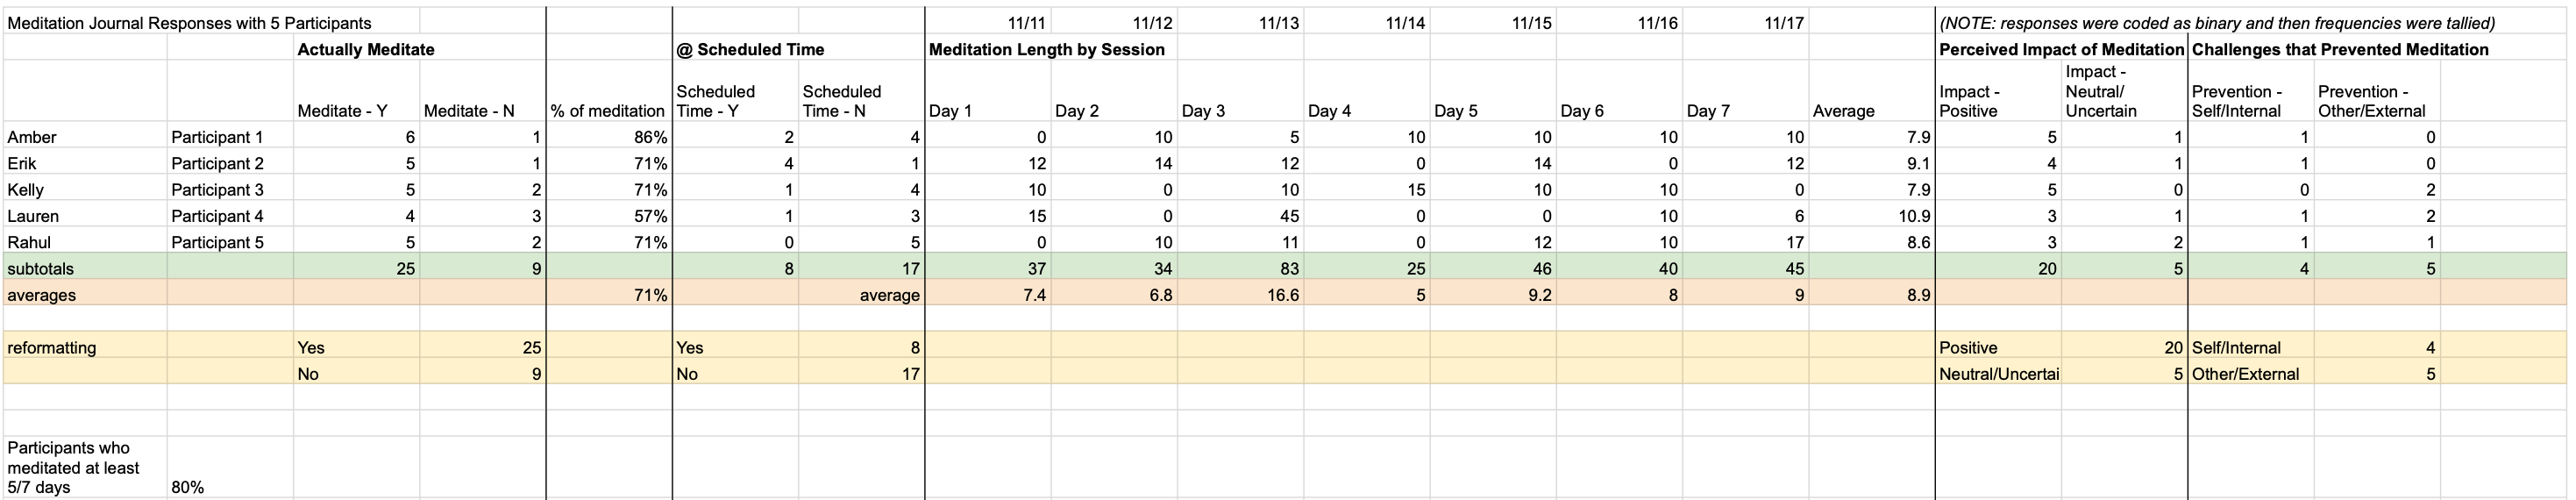
Figure 8. Diary study data analysis in Google Sheets
Findings highlighted that participants averaged 9 minutes per session, which was considered great for a group of self-described busy individuals who were struggling to establish a habit (see Figure 9).
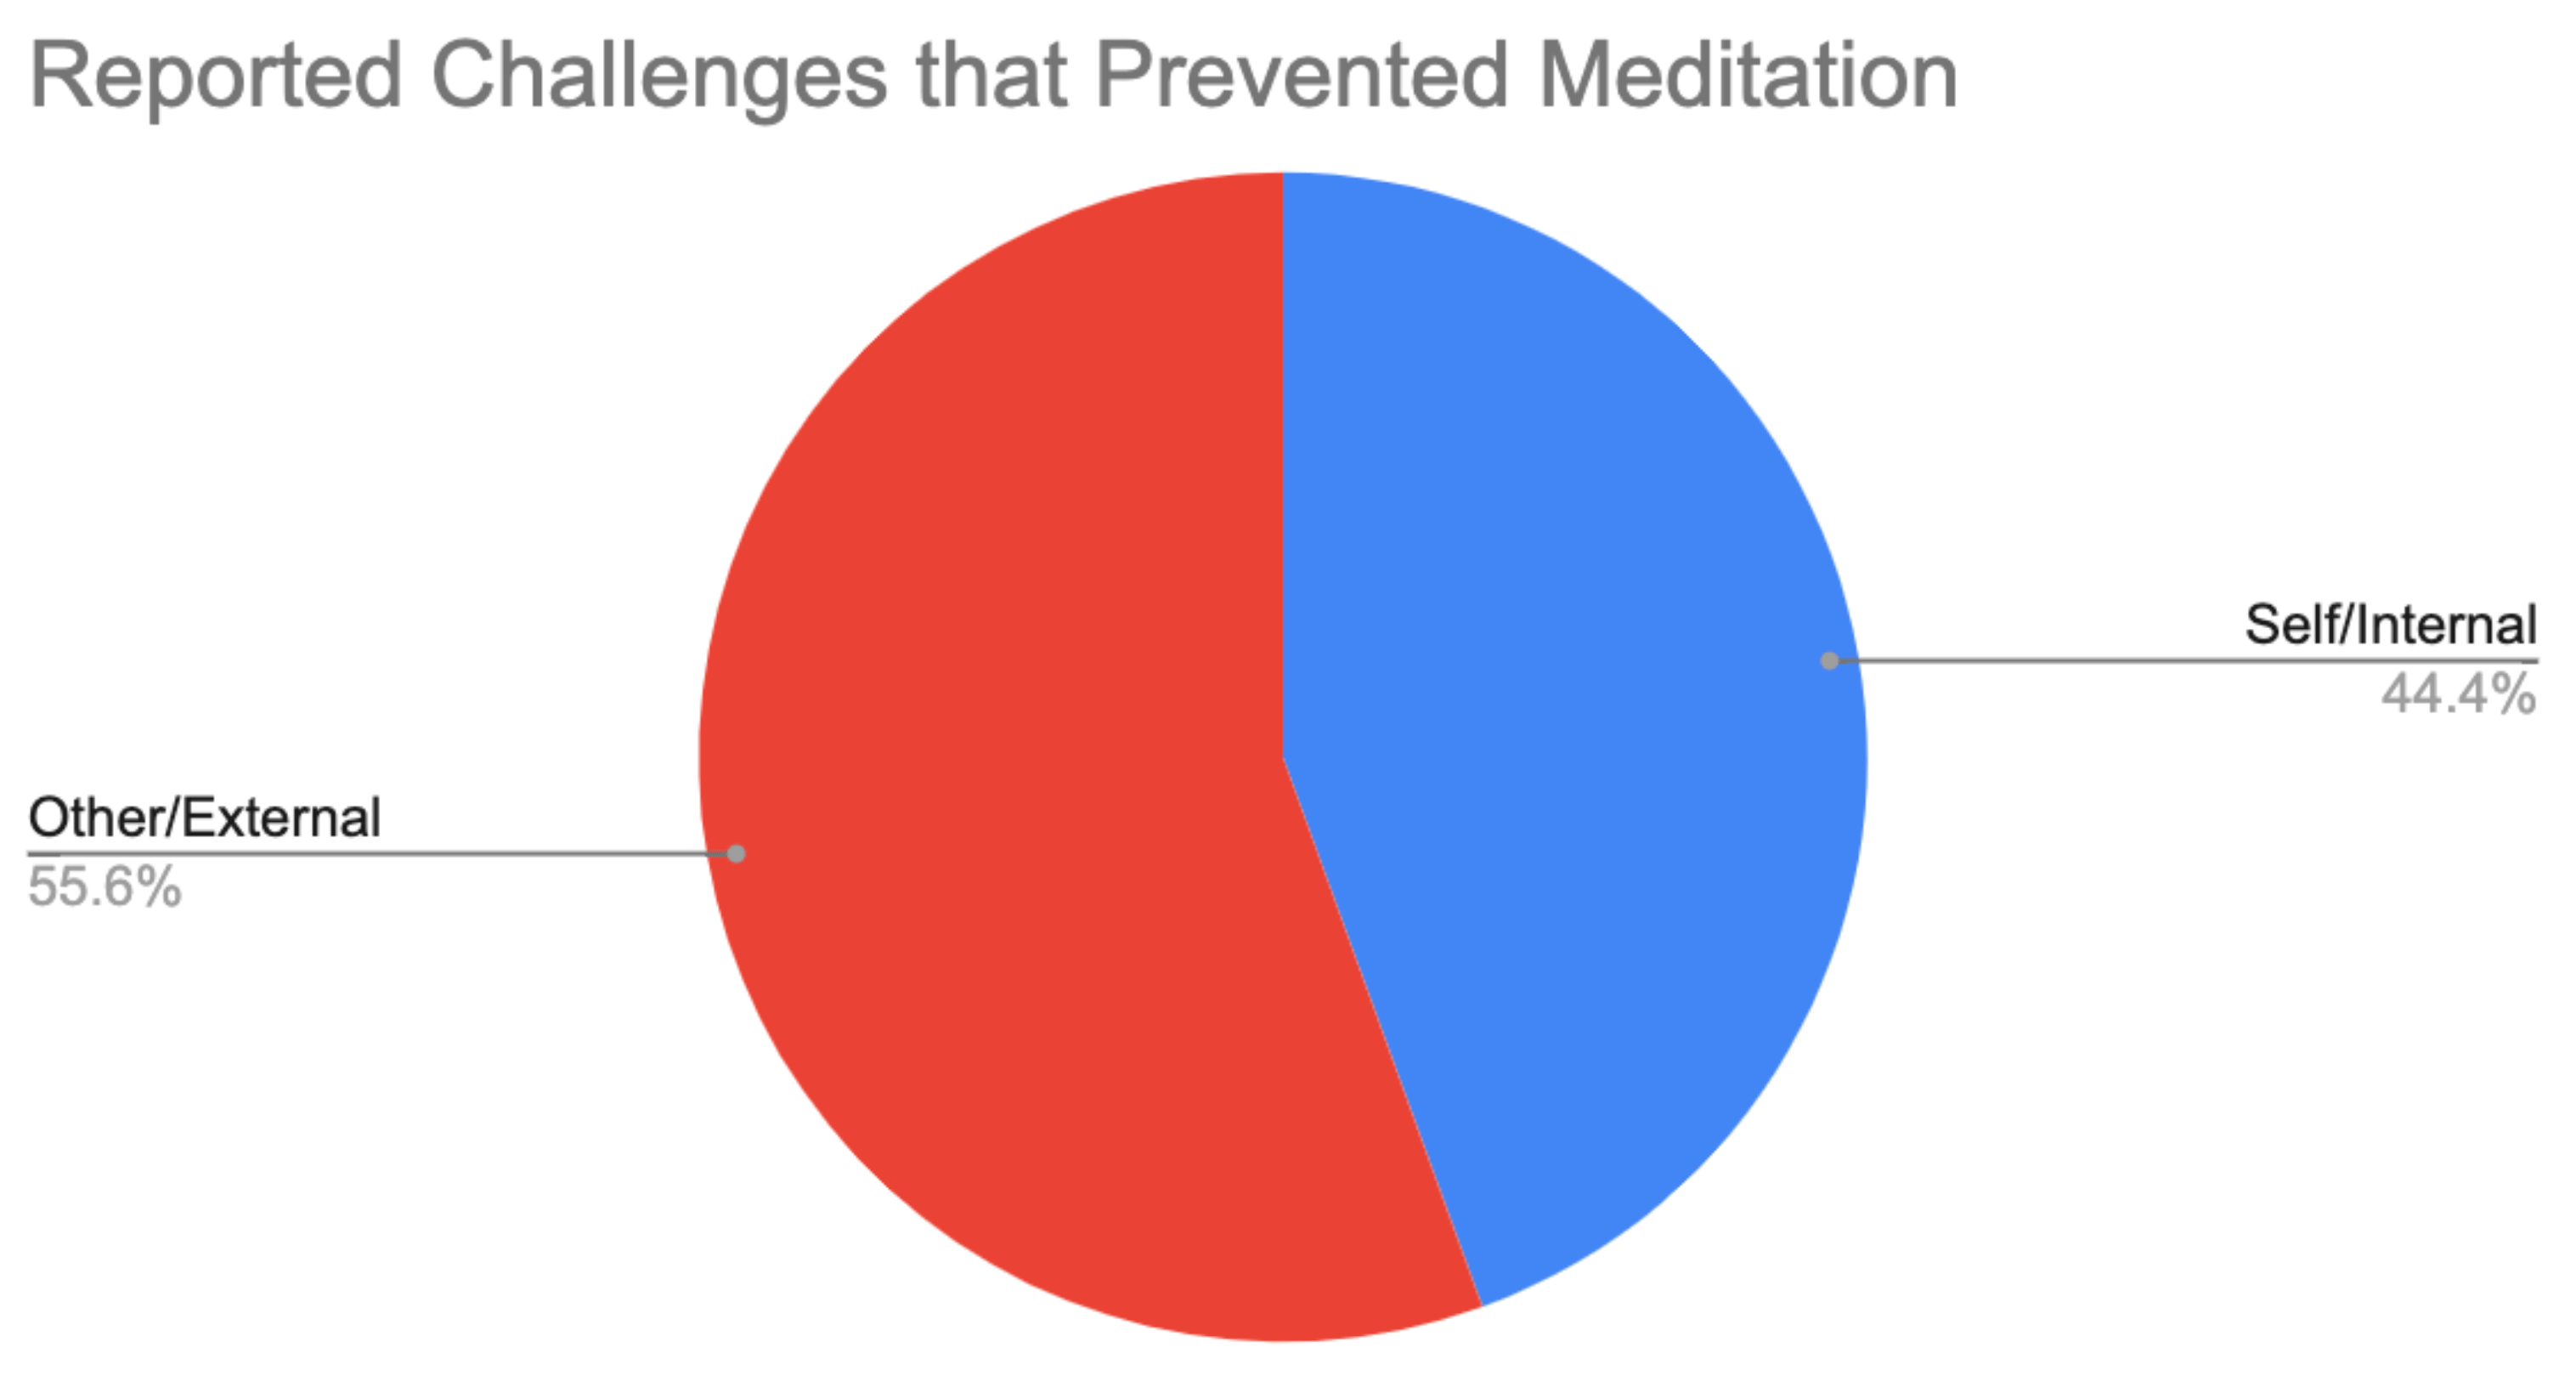
Sentiment analysis of participants’ open-ended qualitative responses from the diary study also helped us see their growing awareness of internal and external factors that prevented them from meditating on certain days (see Figure 10).
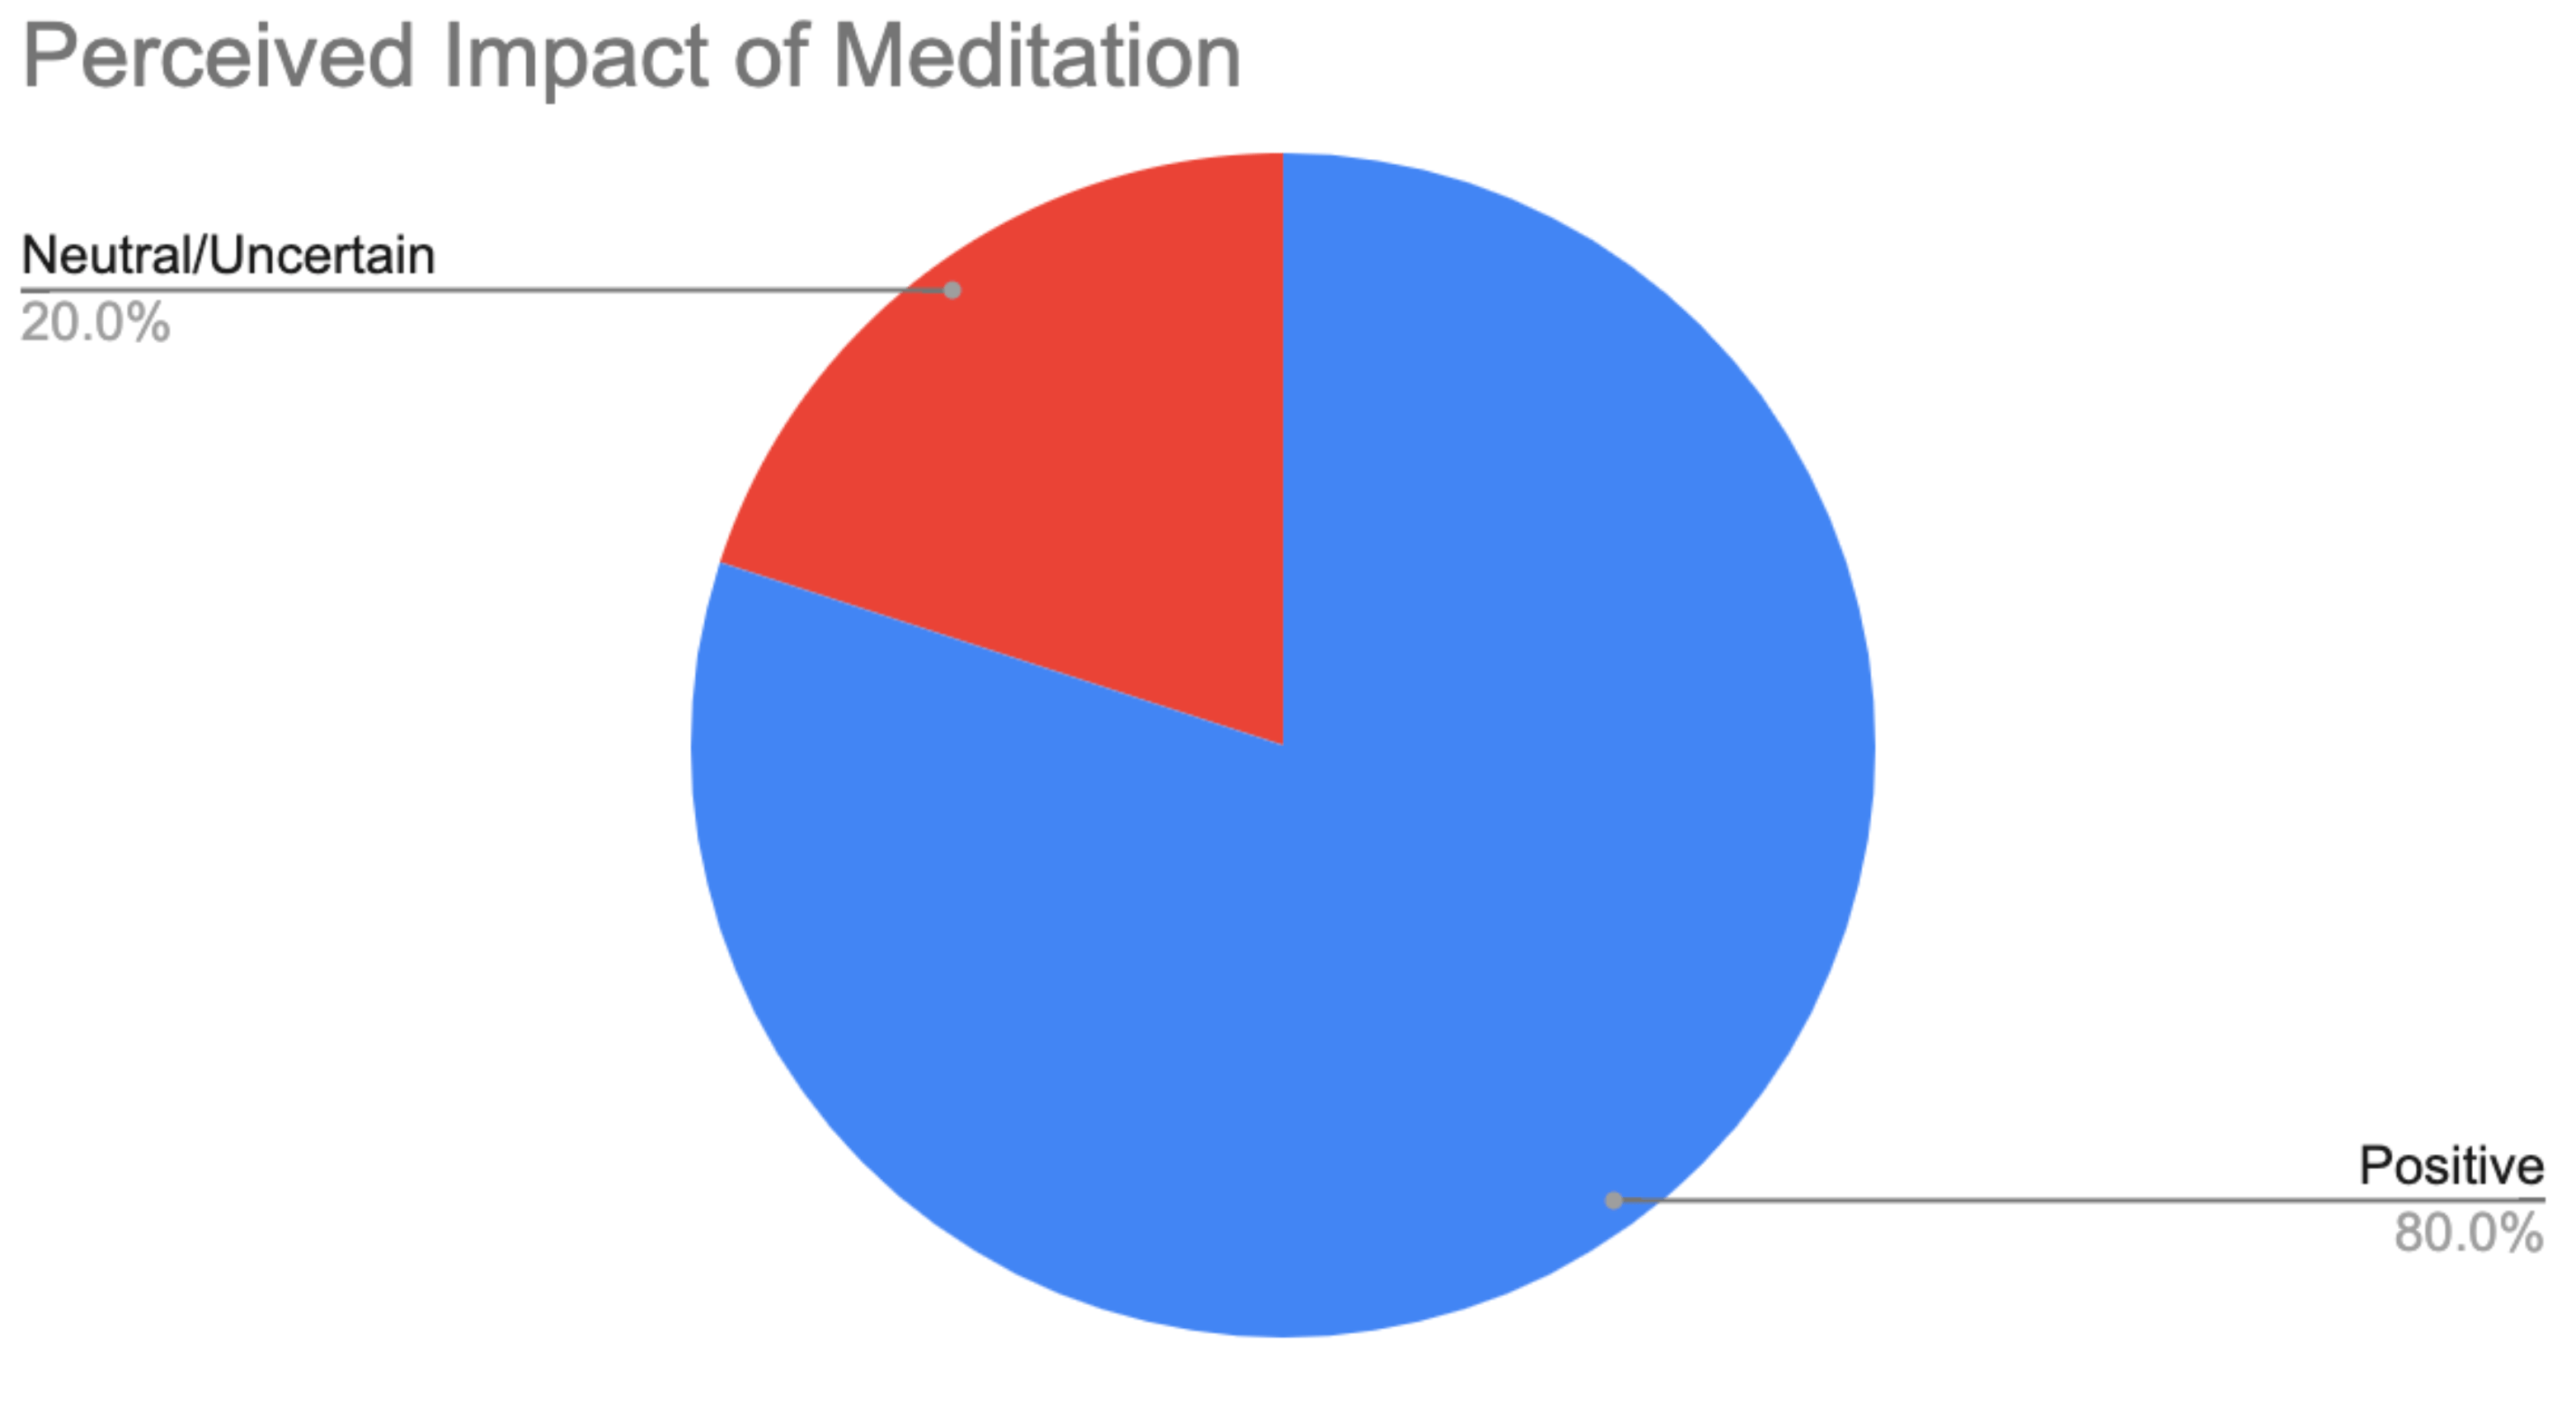
Additionally, their open-ended qualitative responses helped us see their perceived impact of each session, of which 80% of the sessions were rated as having a positive impact or 20 out of 25 sessions (see Figure 11).
Impact
Finally, our team shared a readout with stakeholders. We highlighted data from discovery interviews and rapid experiments to back up our recommendations for new meditation app features:
- Based on the increase of 9 average minutes spent meditating, we recommended adding a calendar synchronization feature between the app and the user’s personal calendar.
- Based on 80% of participants having positive perceptions of their meditation during the diary study, we recommended adding a journal feature that combines both quantitative and qualitative questions, and provides simple charts for user’s to track progress for session length and perceived impact.
Creating the Design Prompt Generator to inspire fun learning
Project Overview
Problem
Educators in my local community wanted to quickly generate design prompts for their classroom or out-of-school workshops, but didn’t have access to an affordable tool that could generate prompts for a wide variety of content areas (e.g., art, engineering, math, etc.).
Method
The entire process went from sketch to high-fidelity prototype in one month. This project used an iterative design cycle with multiple phases of research (i.e., moderated discovery interviews, unmoderated usability testing) and design (i.e., low-fidelity mockups, high-fidelity prototype). Several tools were used throughout the project, including Google Workspace, Zoom, Figma, Lookback, Material.io, Miro, and Zeplin.
Impact
Results from the final prototype showed usability increased by 12.5% for design app prototype.
My role
I personally completed each phase of the UX research and UI prototyping for this project. This included conducting a competitive analysis, facilitating discovery interview research, sketching mockups, creating a UI design library, designing Figma wireframes, conducting unmoderated usability, iterating the design, and presenting a readout to stakeholders.
Process Details
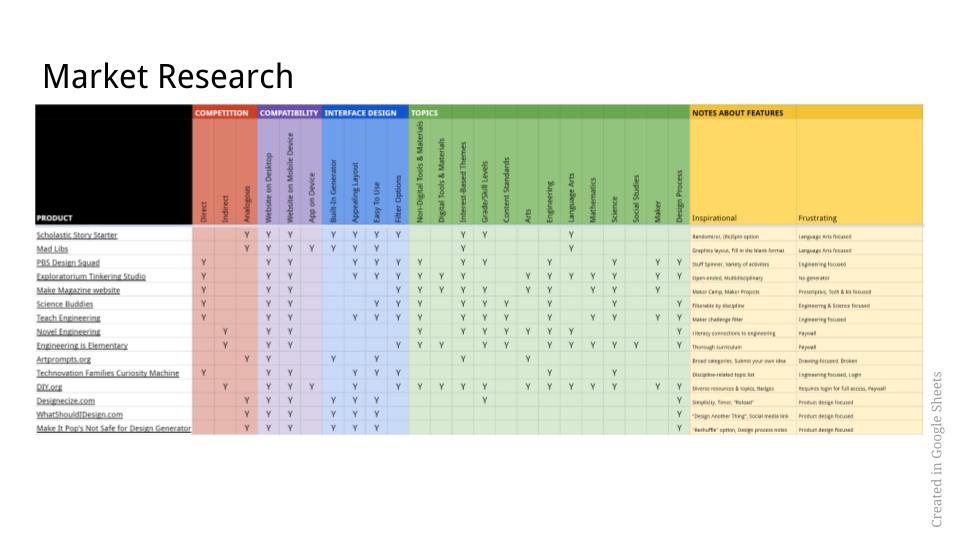
Market research
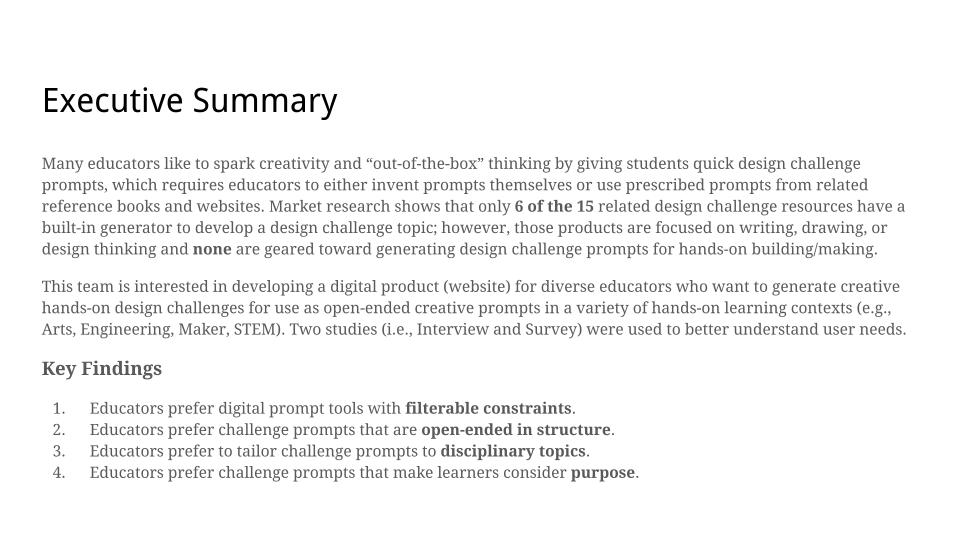
Competitive analysis of the market at the time showed that only 6 of the 15 related design challenge resources had a built-in generator to develop a design prompt. However, none of the products were geared toward generating design prompts for art, engineering, or other hands-on building/making contexts (i.e., existing products were focused on writing, drawing, or design thinking).
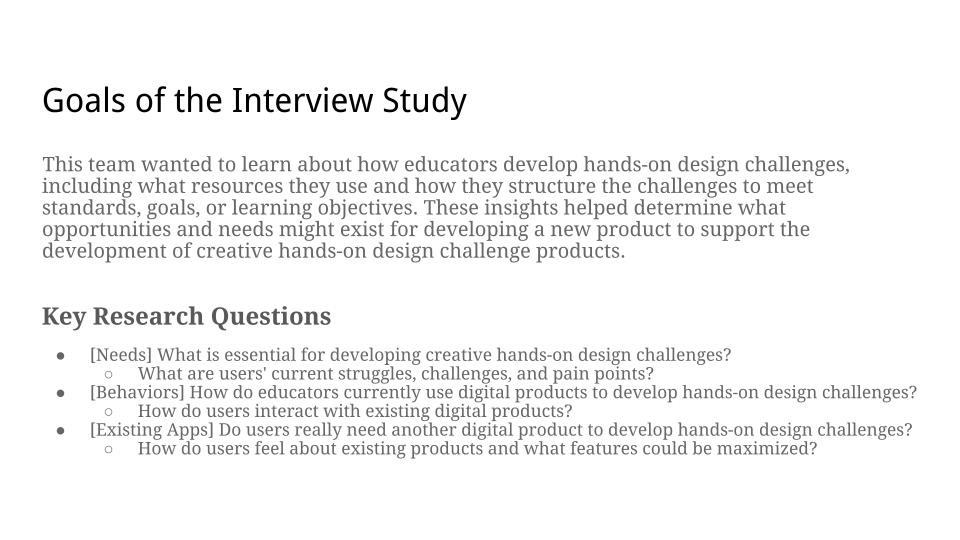
Discovery research
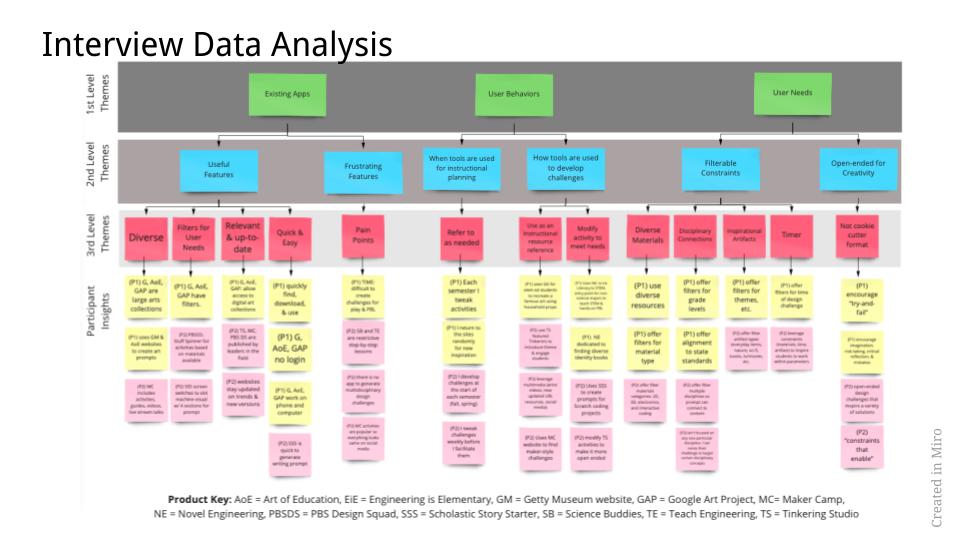
I started the project with two exploratory studies to better understand user needs, behaviors, and preferential use of existing products. Google Sheets and Miro were used to analyze the data.
A 30-minute semi-structured interview via Zoom with two participants identified two key findings:
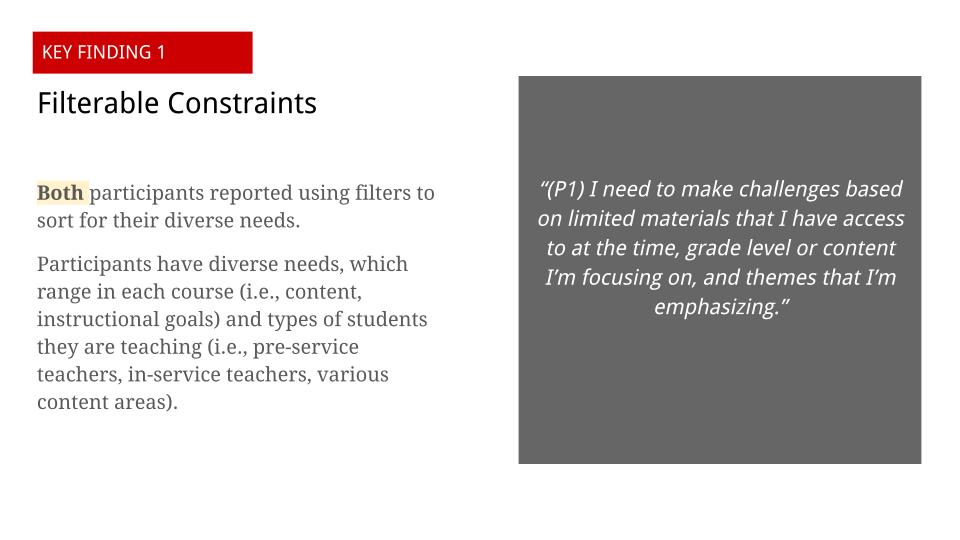
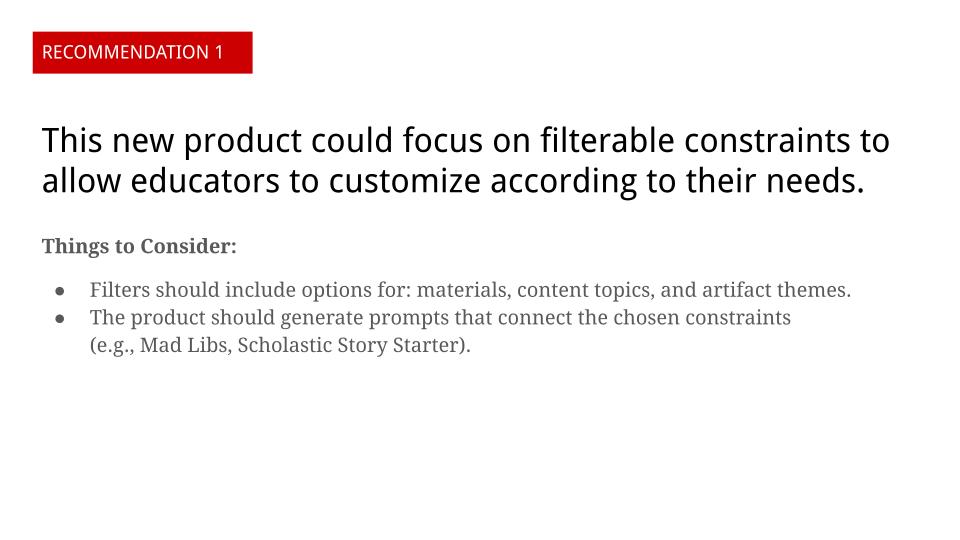
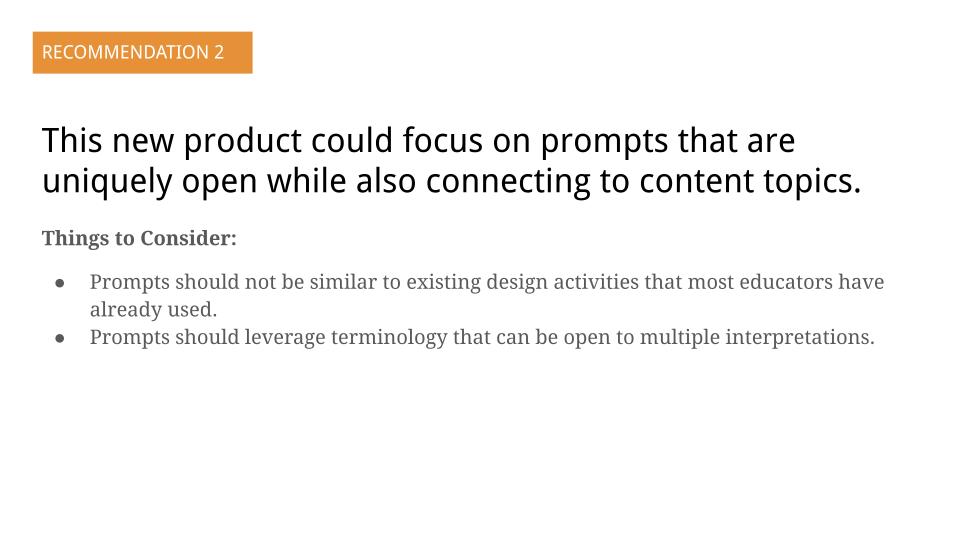
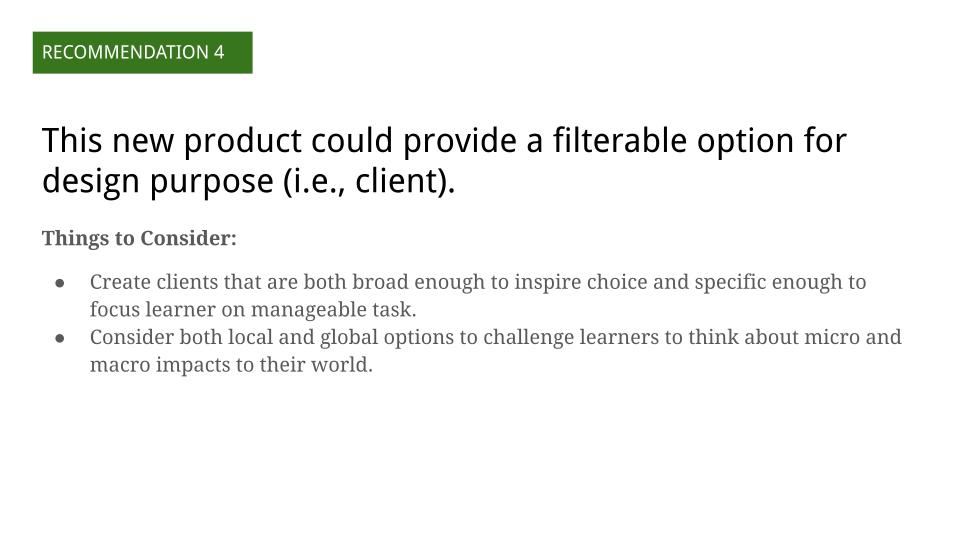
- Educators prefer digital prompt tools with filterable constraints.
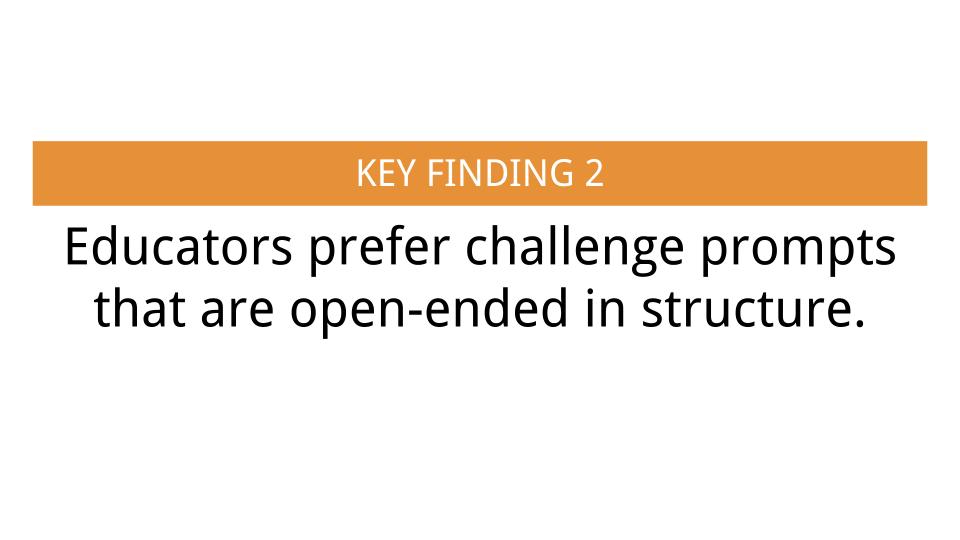
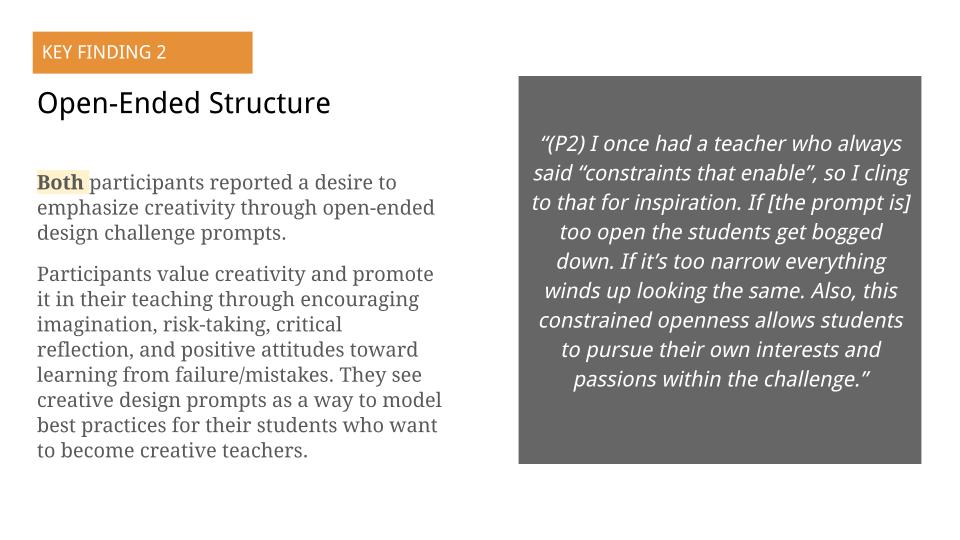
- Educators prefer challenge prompts that are open-ended in structure.
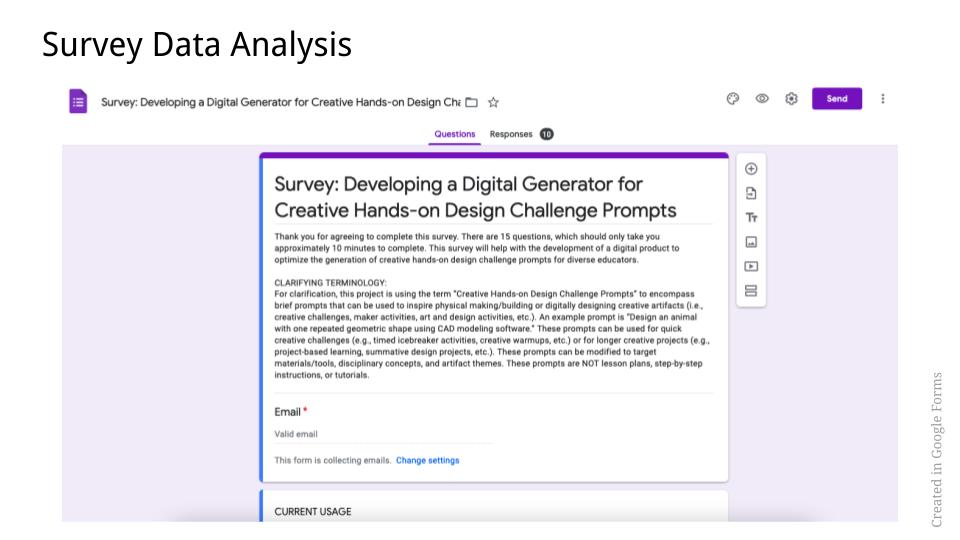
A survey using 15 closed-ended and open-ended questions via Google Forms with 10 participants identified two key findings:
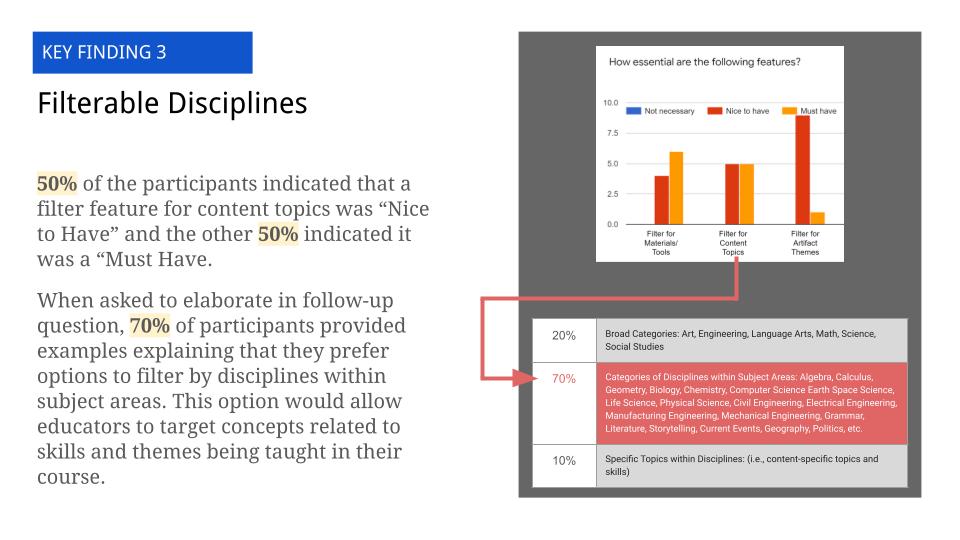
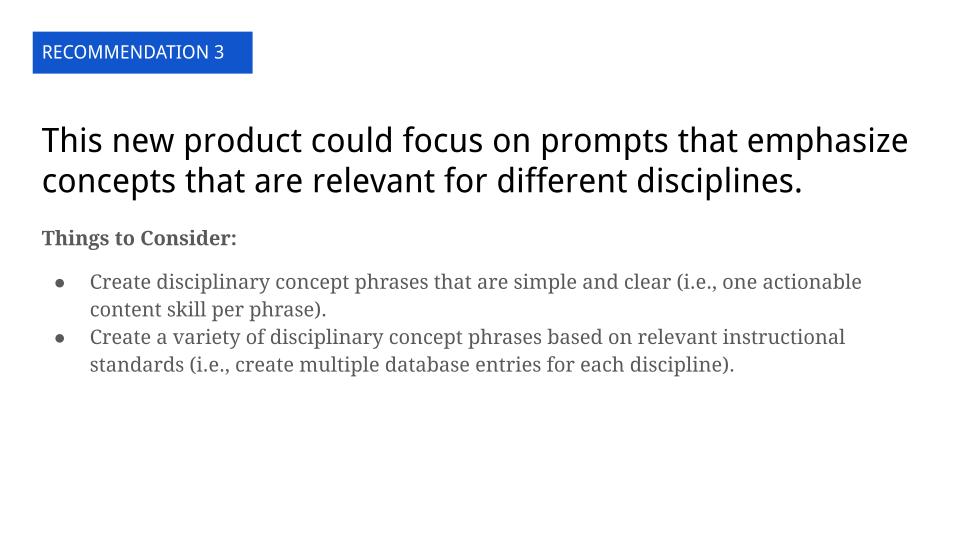
- Educators prefer to tailor challenge prompts to disciplinary topics.
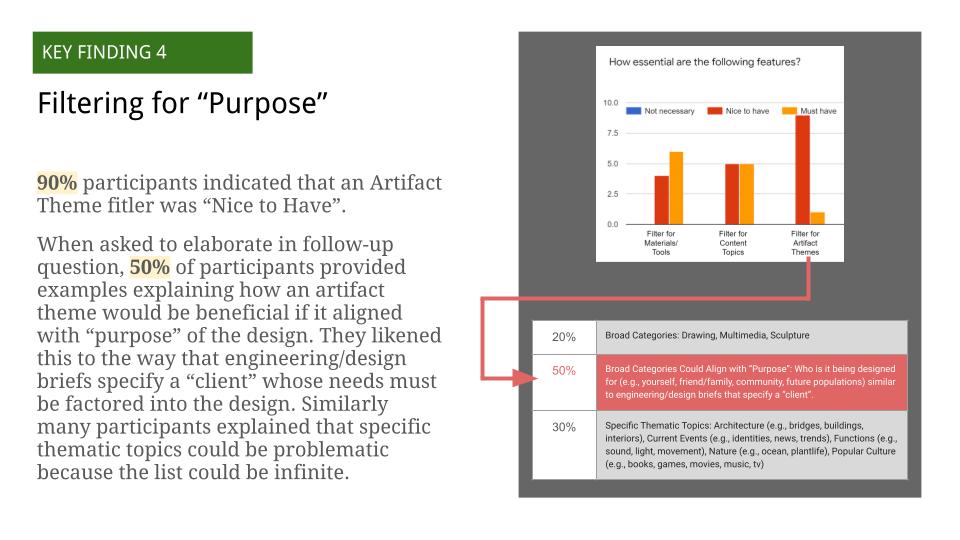
- Educators prefer challenge prompts that make learners consider purpose and design intention.
The complete Exploratory Research Report can be viewed below:


Data and insights from the exploratory research phase were used to ideate features, which were prioritized using a matrix. Sketches were used to evolve the design concept throughout the entire process, using pen/paper and digitally in Miro (see Figure 1).

Usability testing
The exploratory research and sketches were used to develop and test prototypes. Figma was used to create wireframes and clickable prototypes for each iteration. First, a low-fidelity prototype (Wireframe, Clickable Prototype) was tested via Zoom with three participants using moderated usability focused on validation of task flow (see Figure 2). The results indicated:
- 86% success rate with 6/7 tasks being successfully completed.
- 2/3 participants were unsuccessful at completing the final task due to the button being “unnoticeable” and “not intuitive.”
- Open-ended feedback provided helpful suggestions, including “could simplify app name,” “need instructions on homepage,” and “rethink some word choices so younger students can understand, like ‘constraints’ and ‘discipline.’”

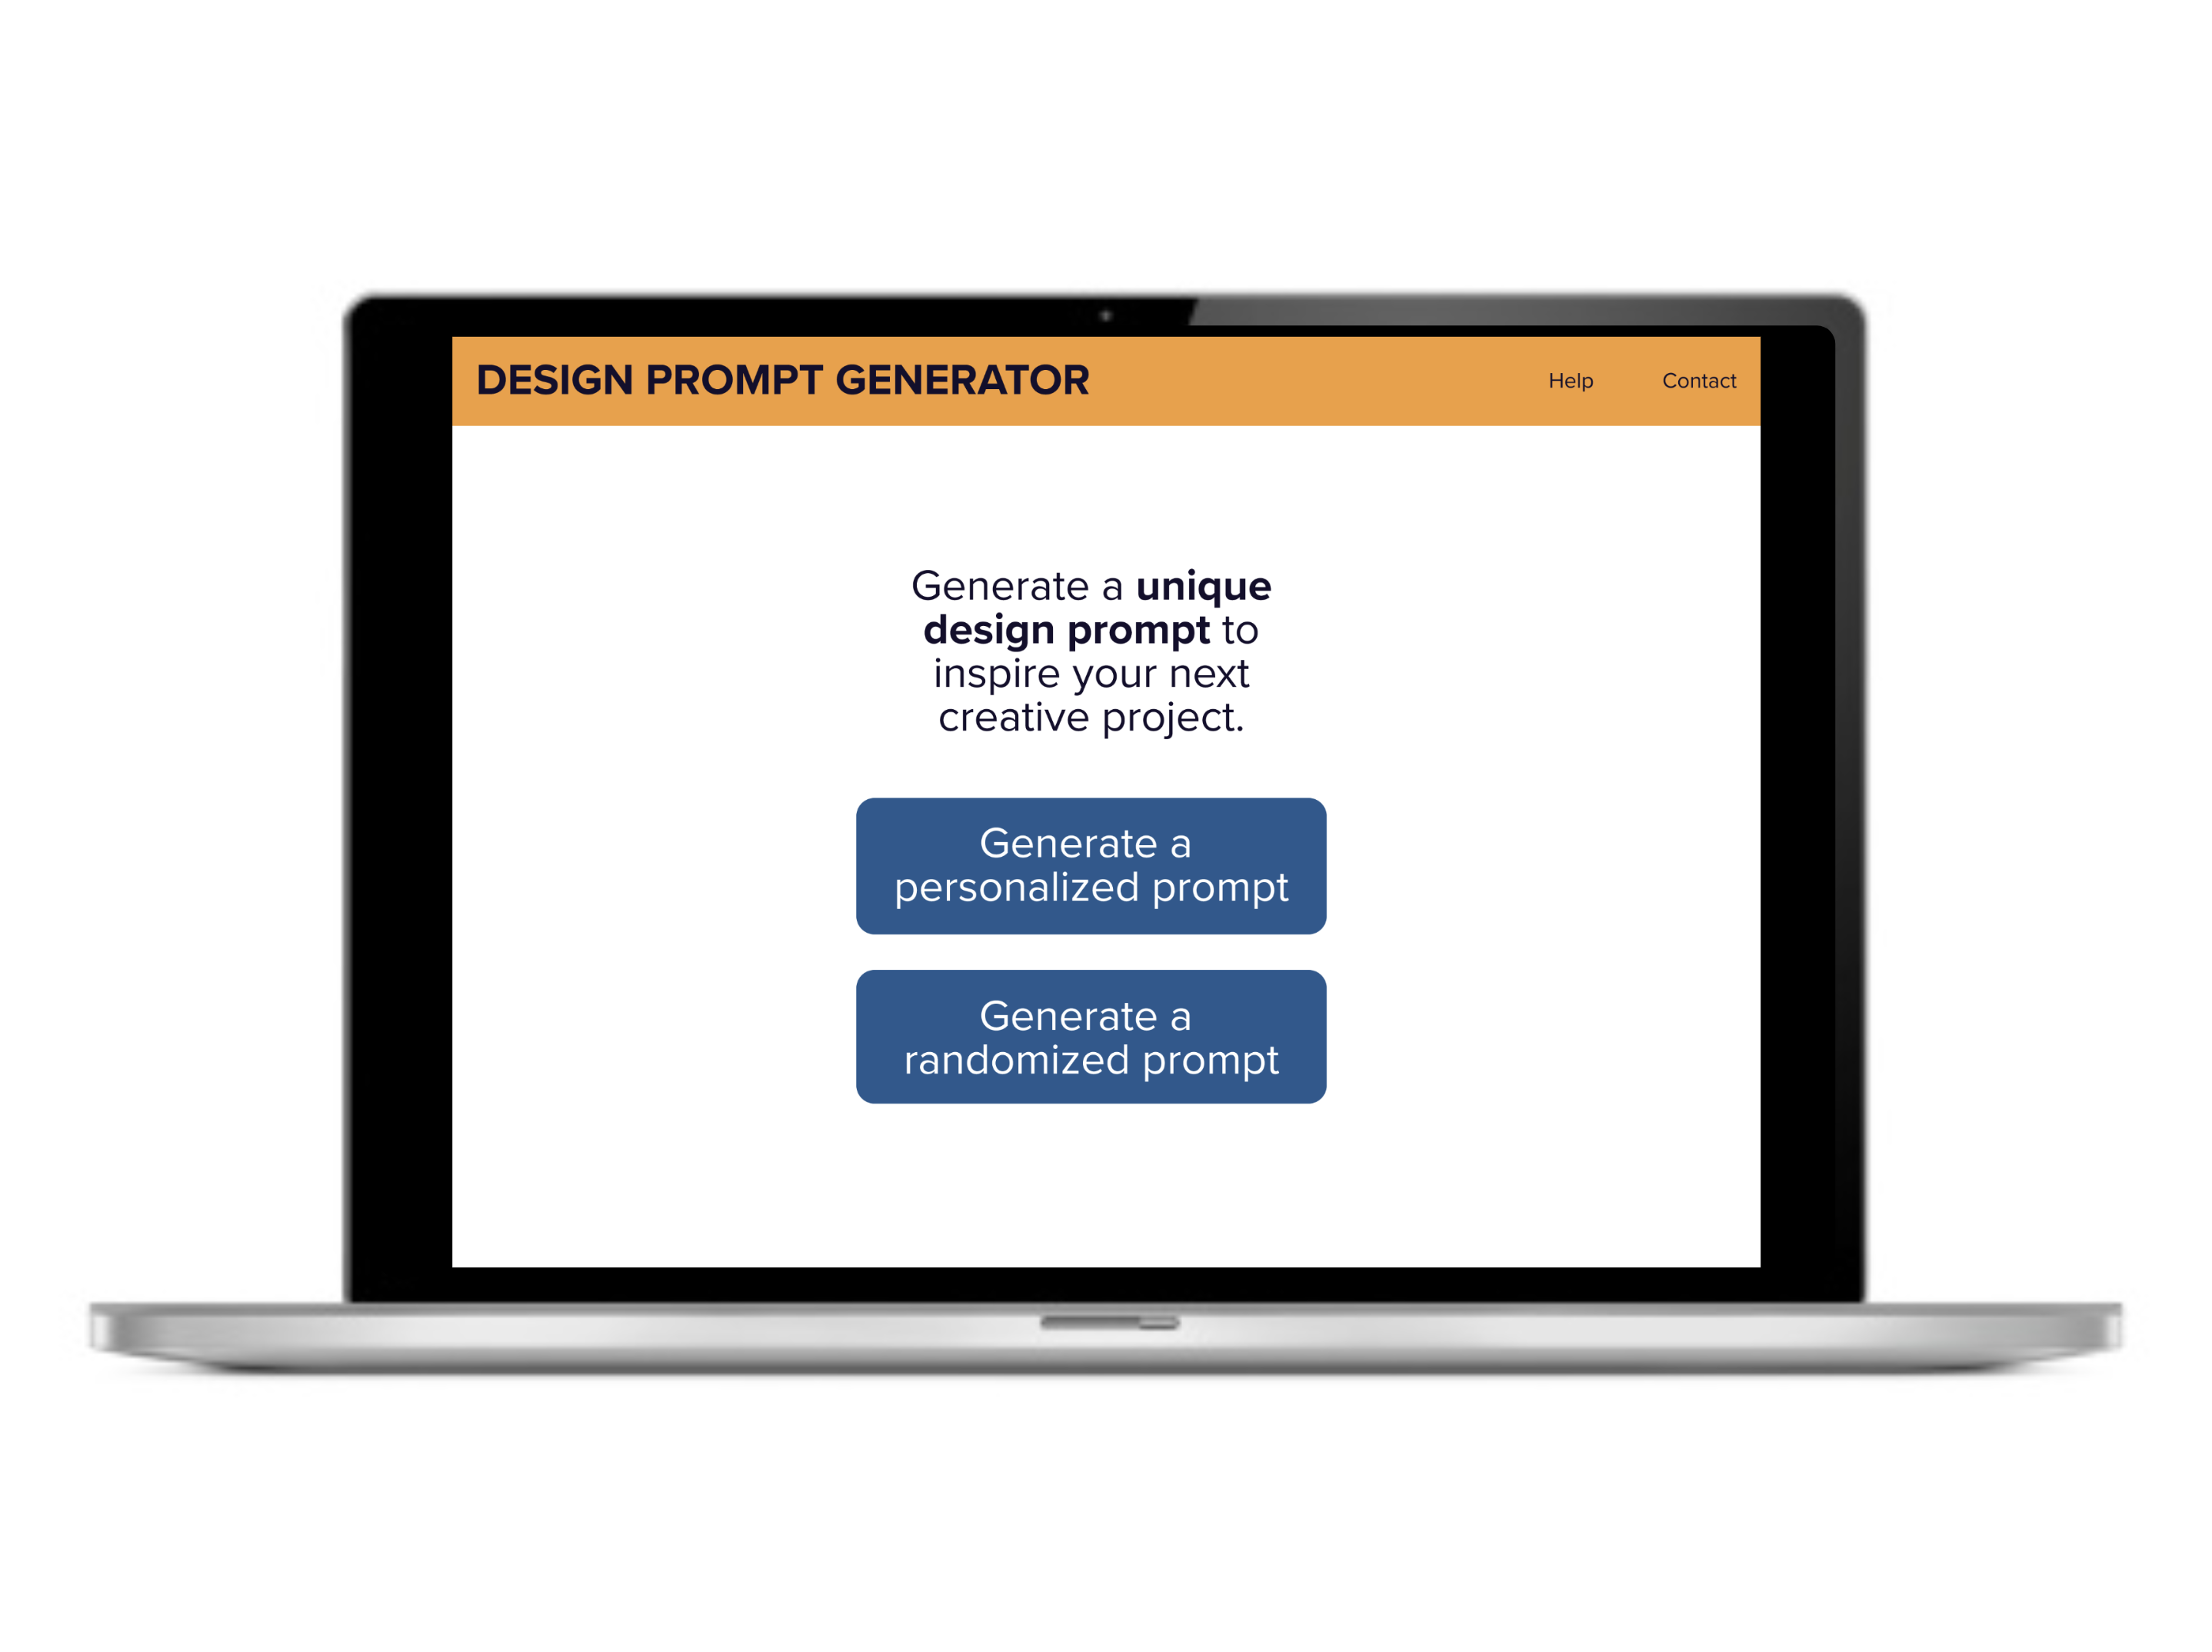
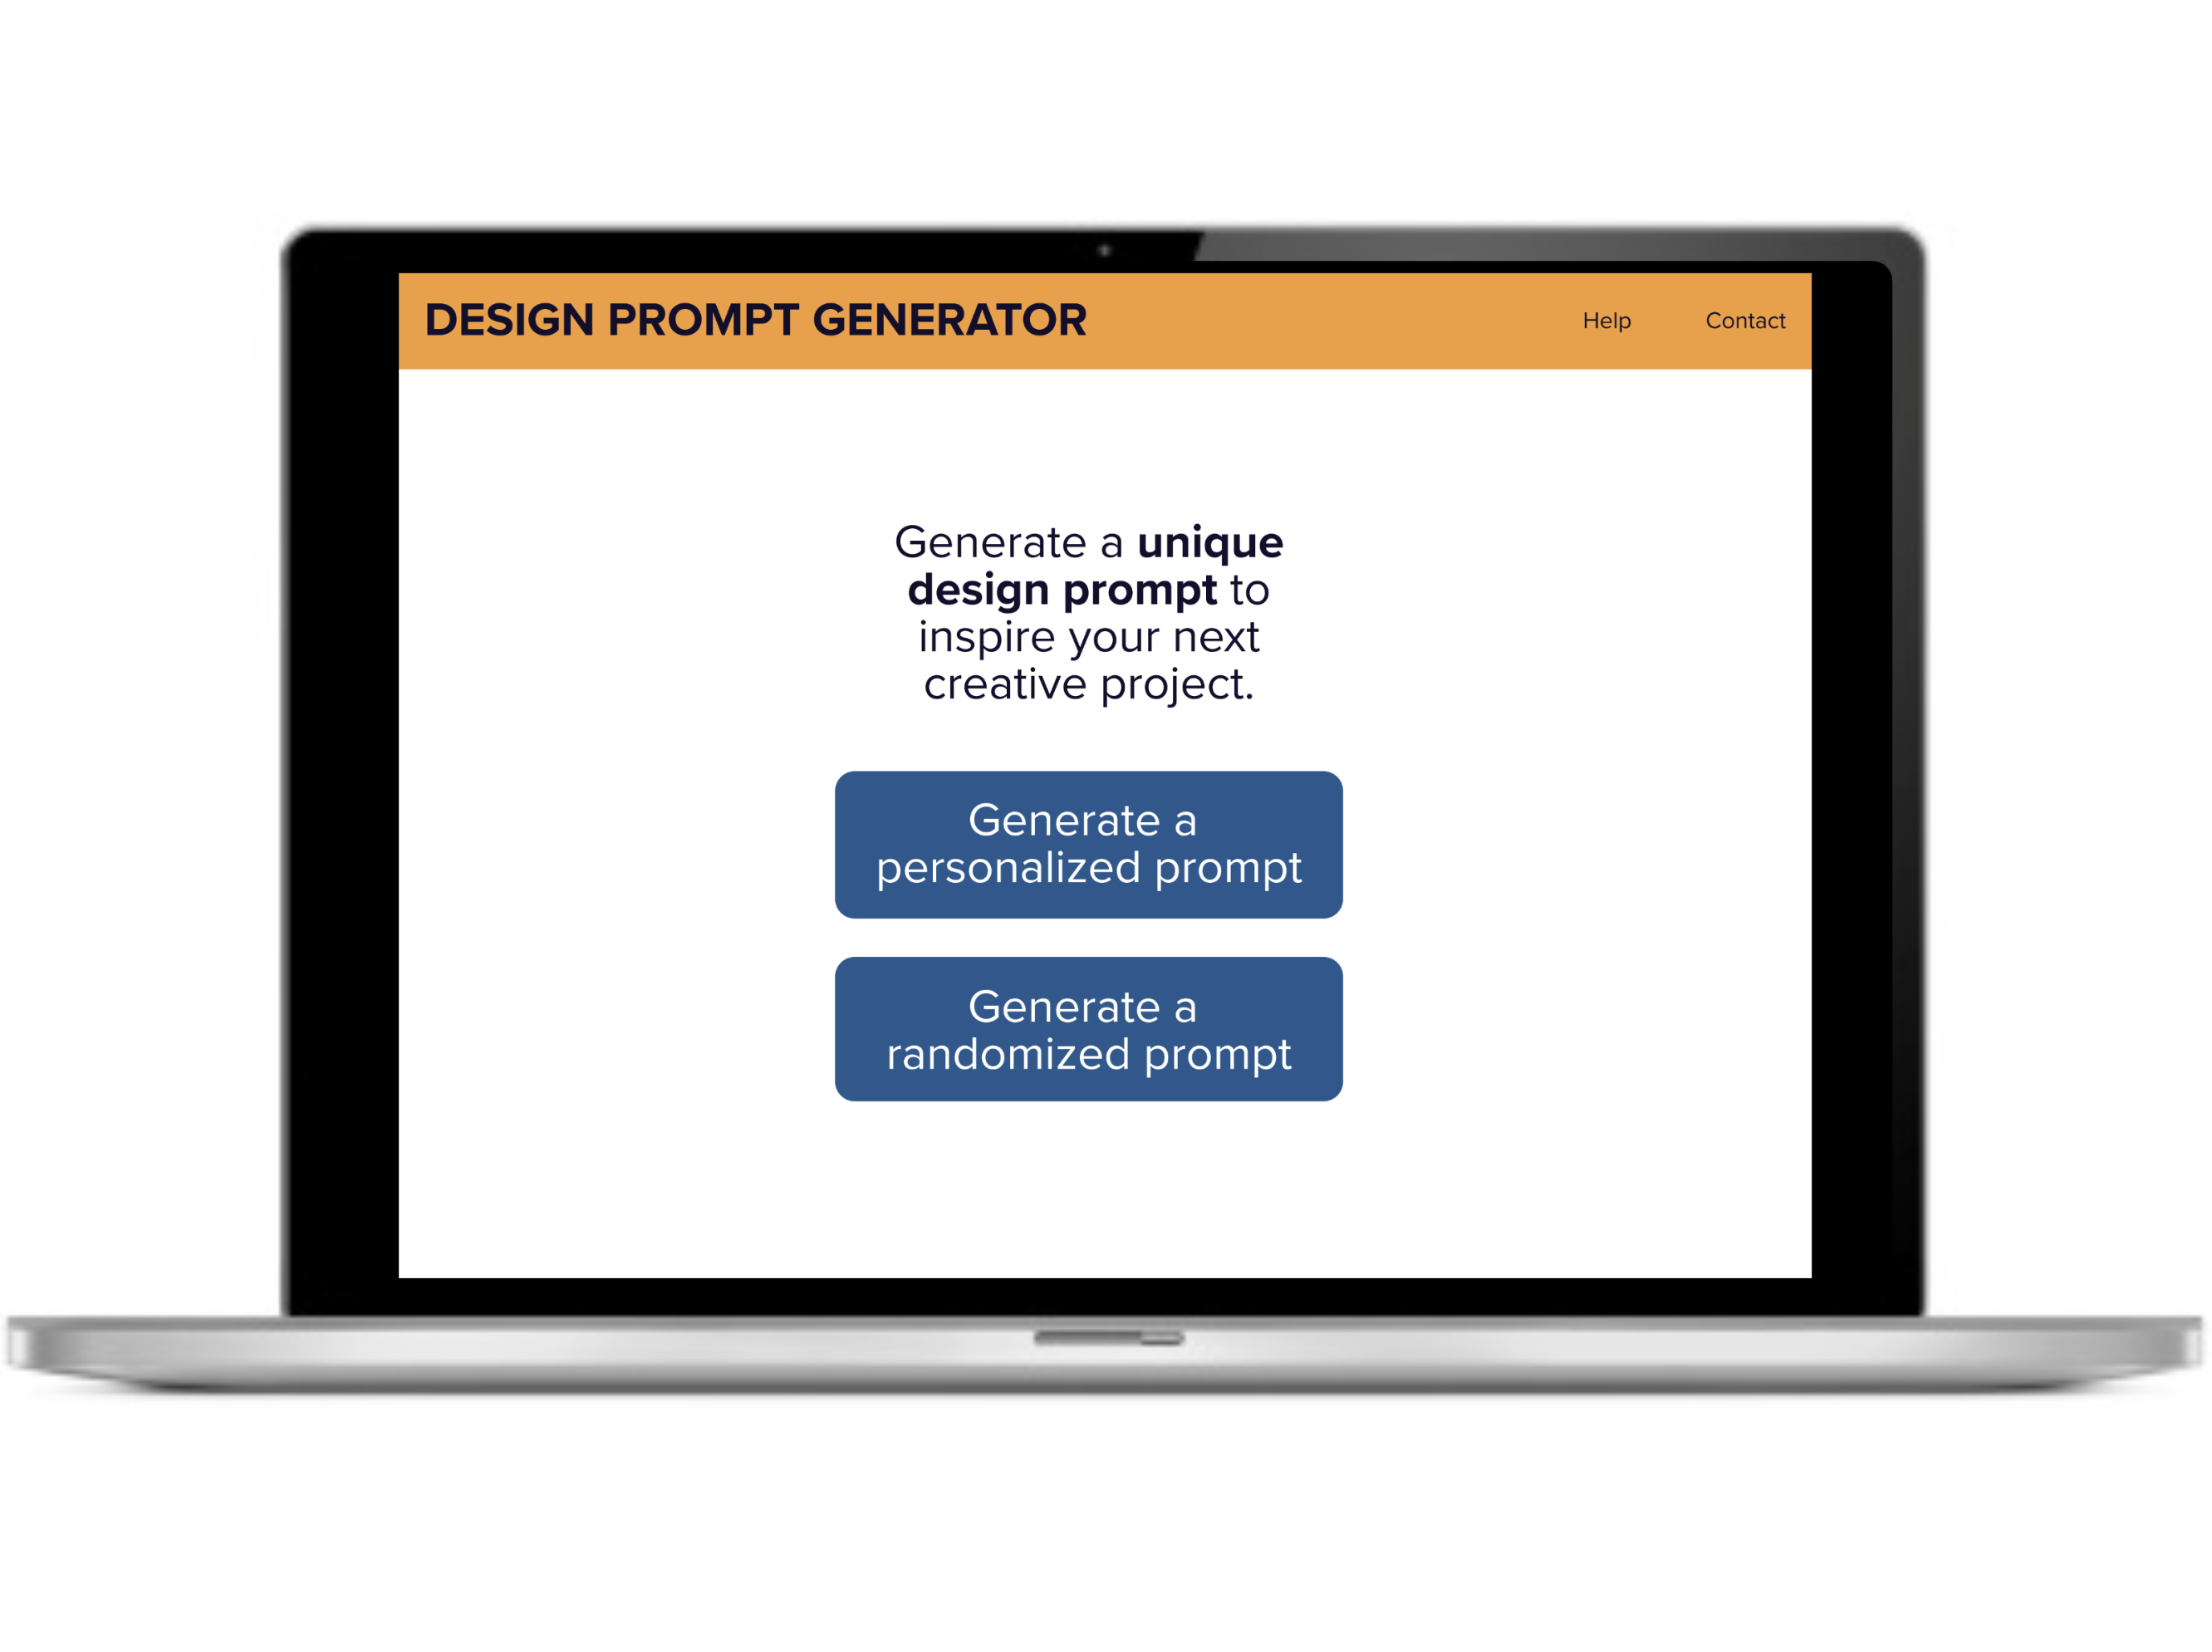
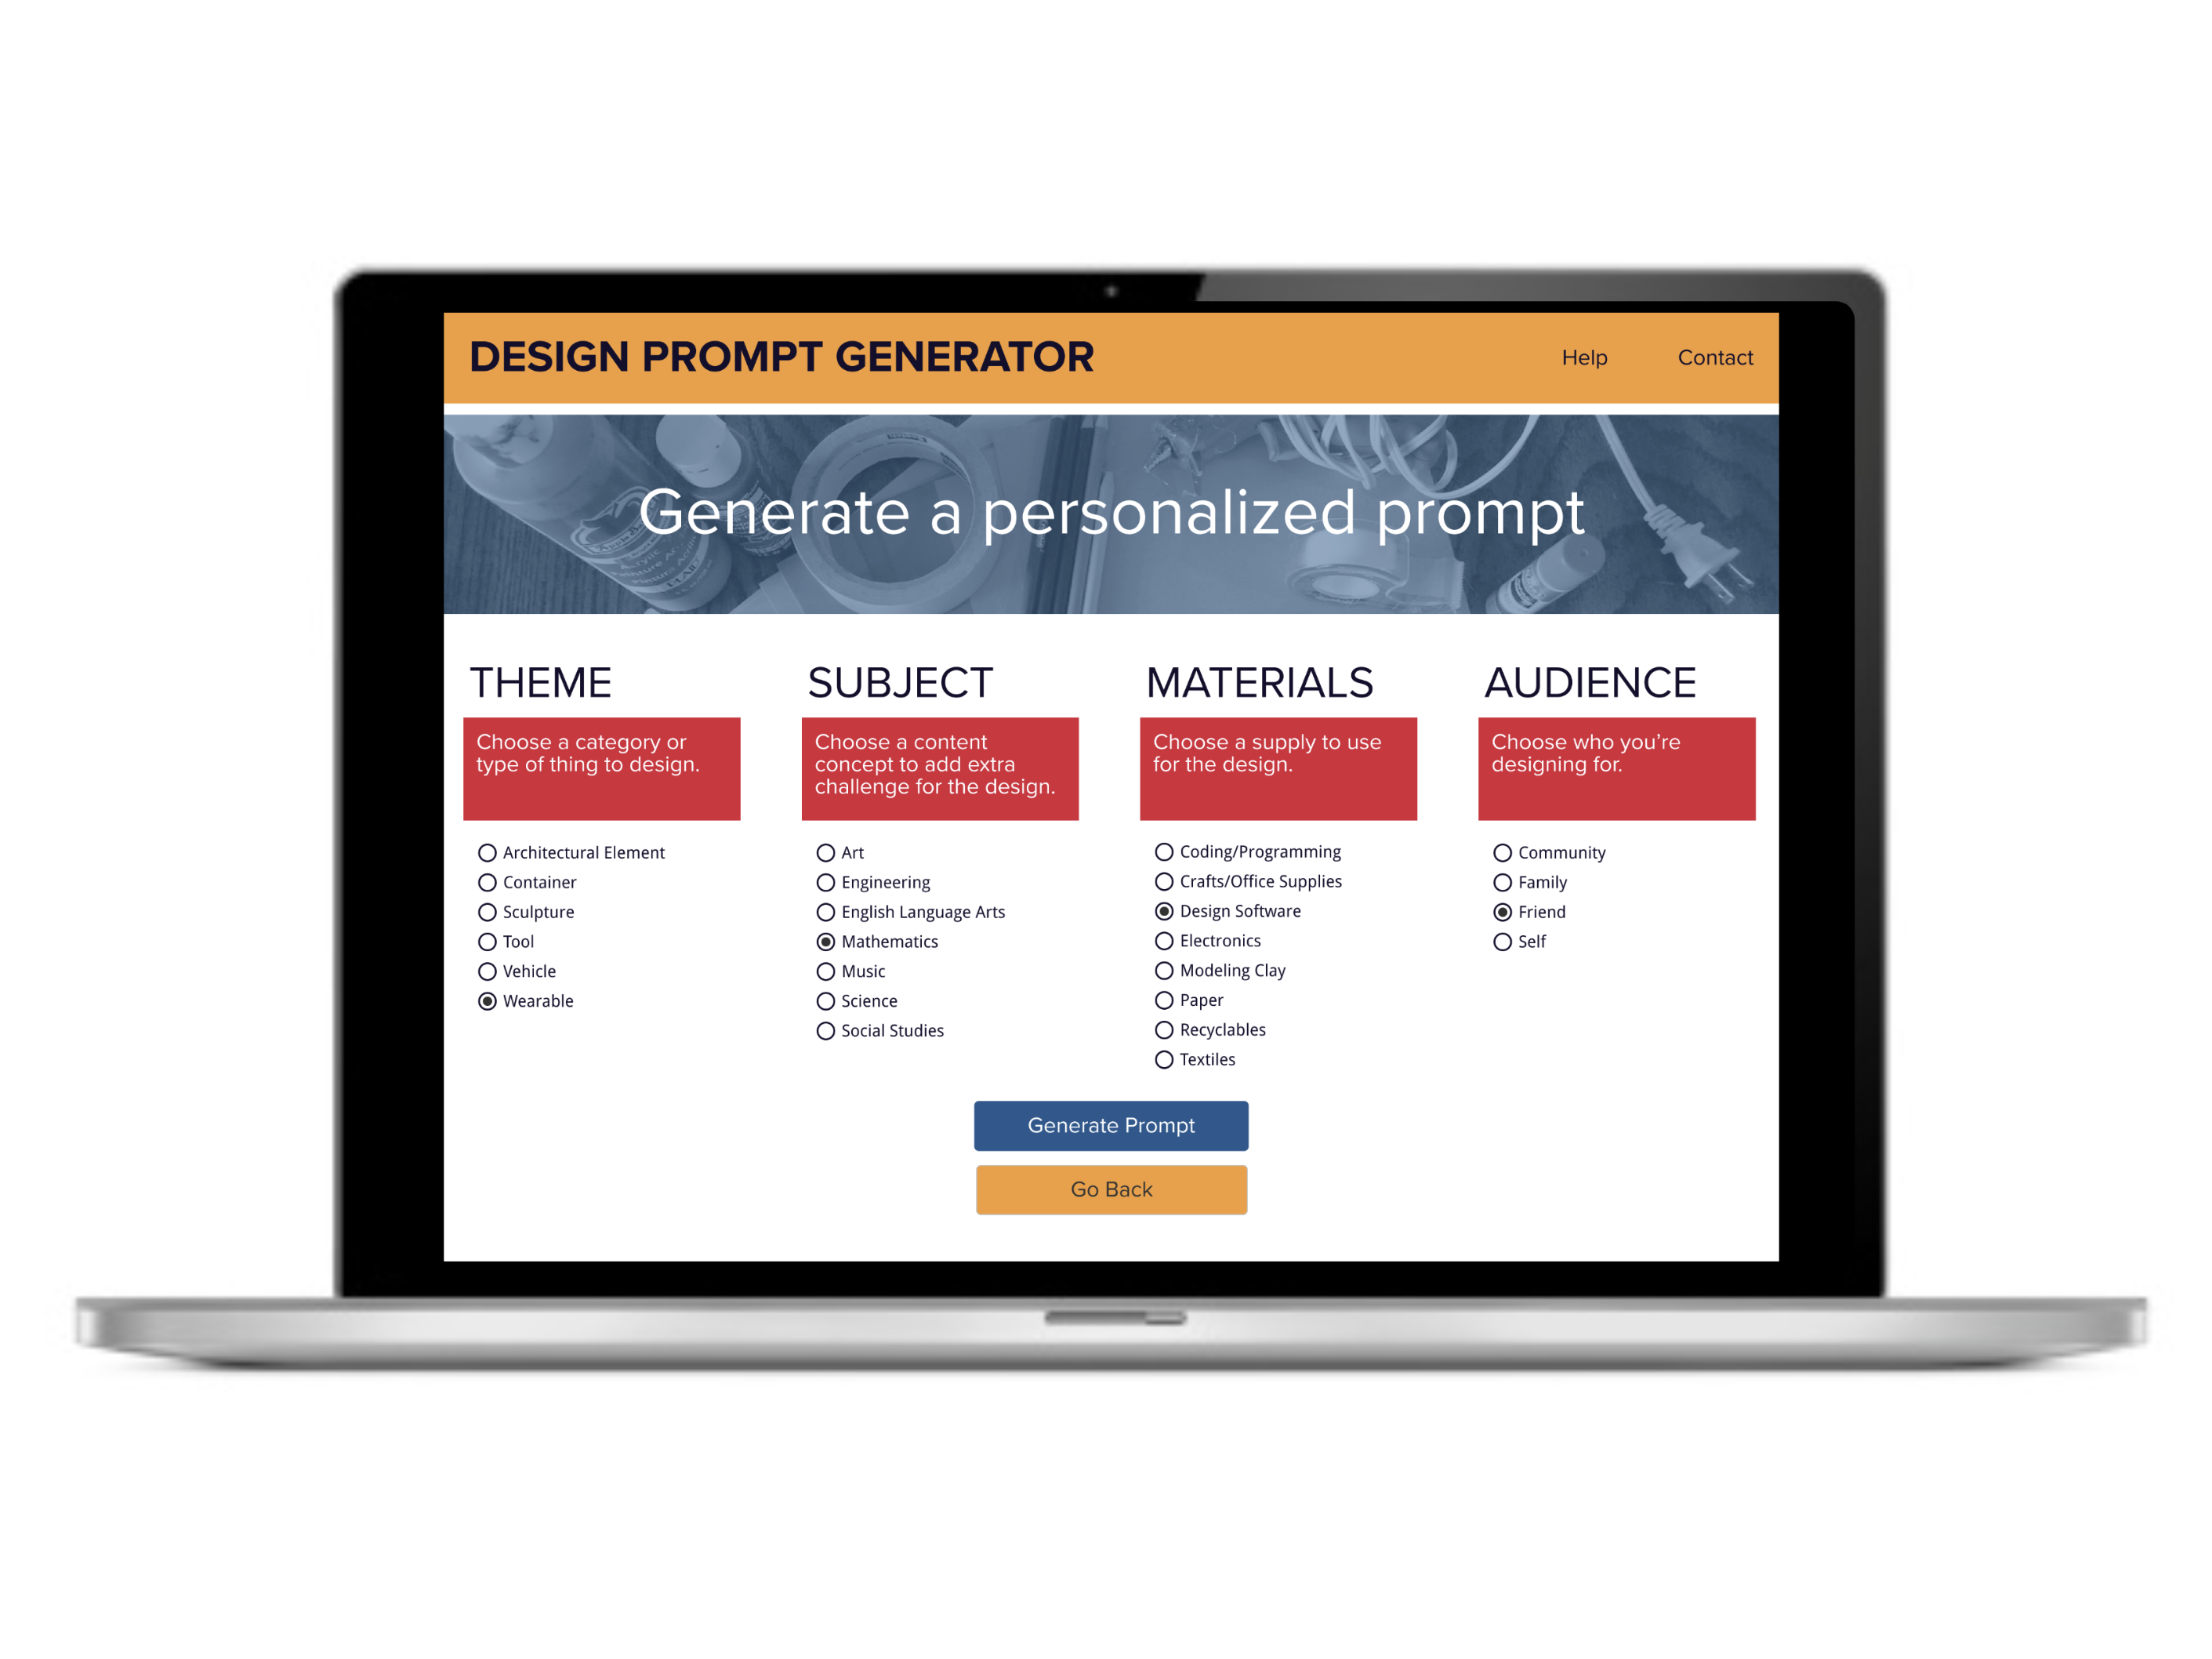
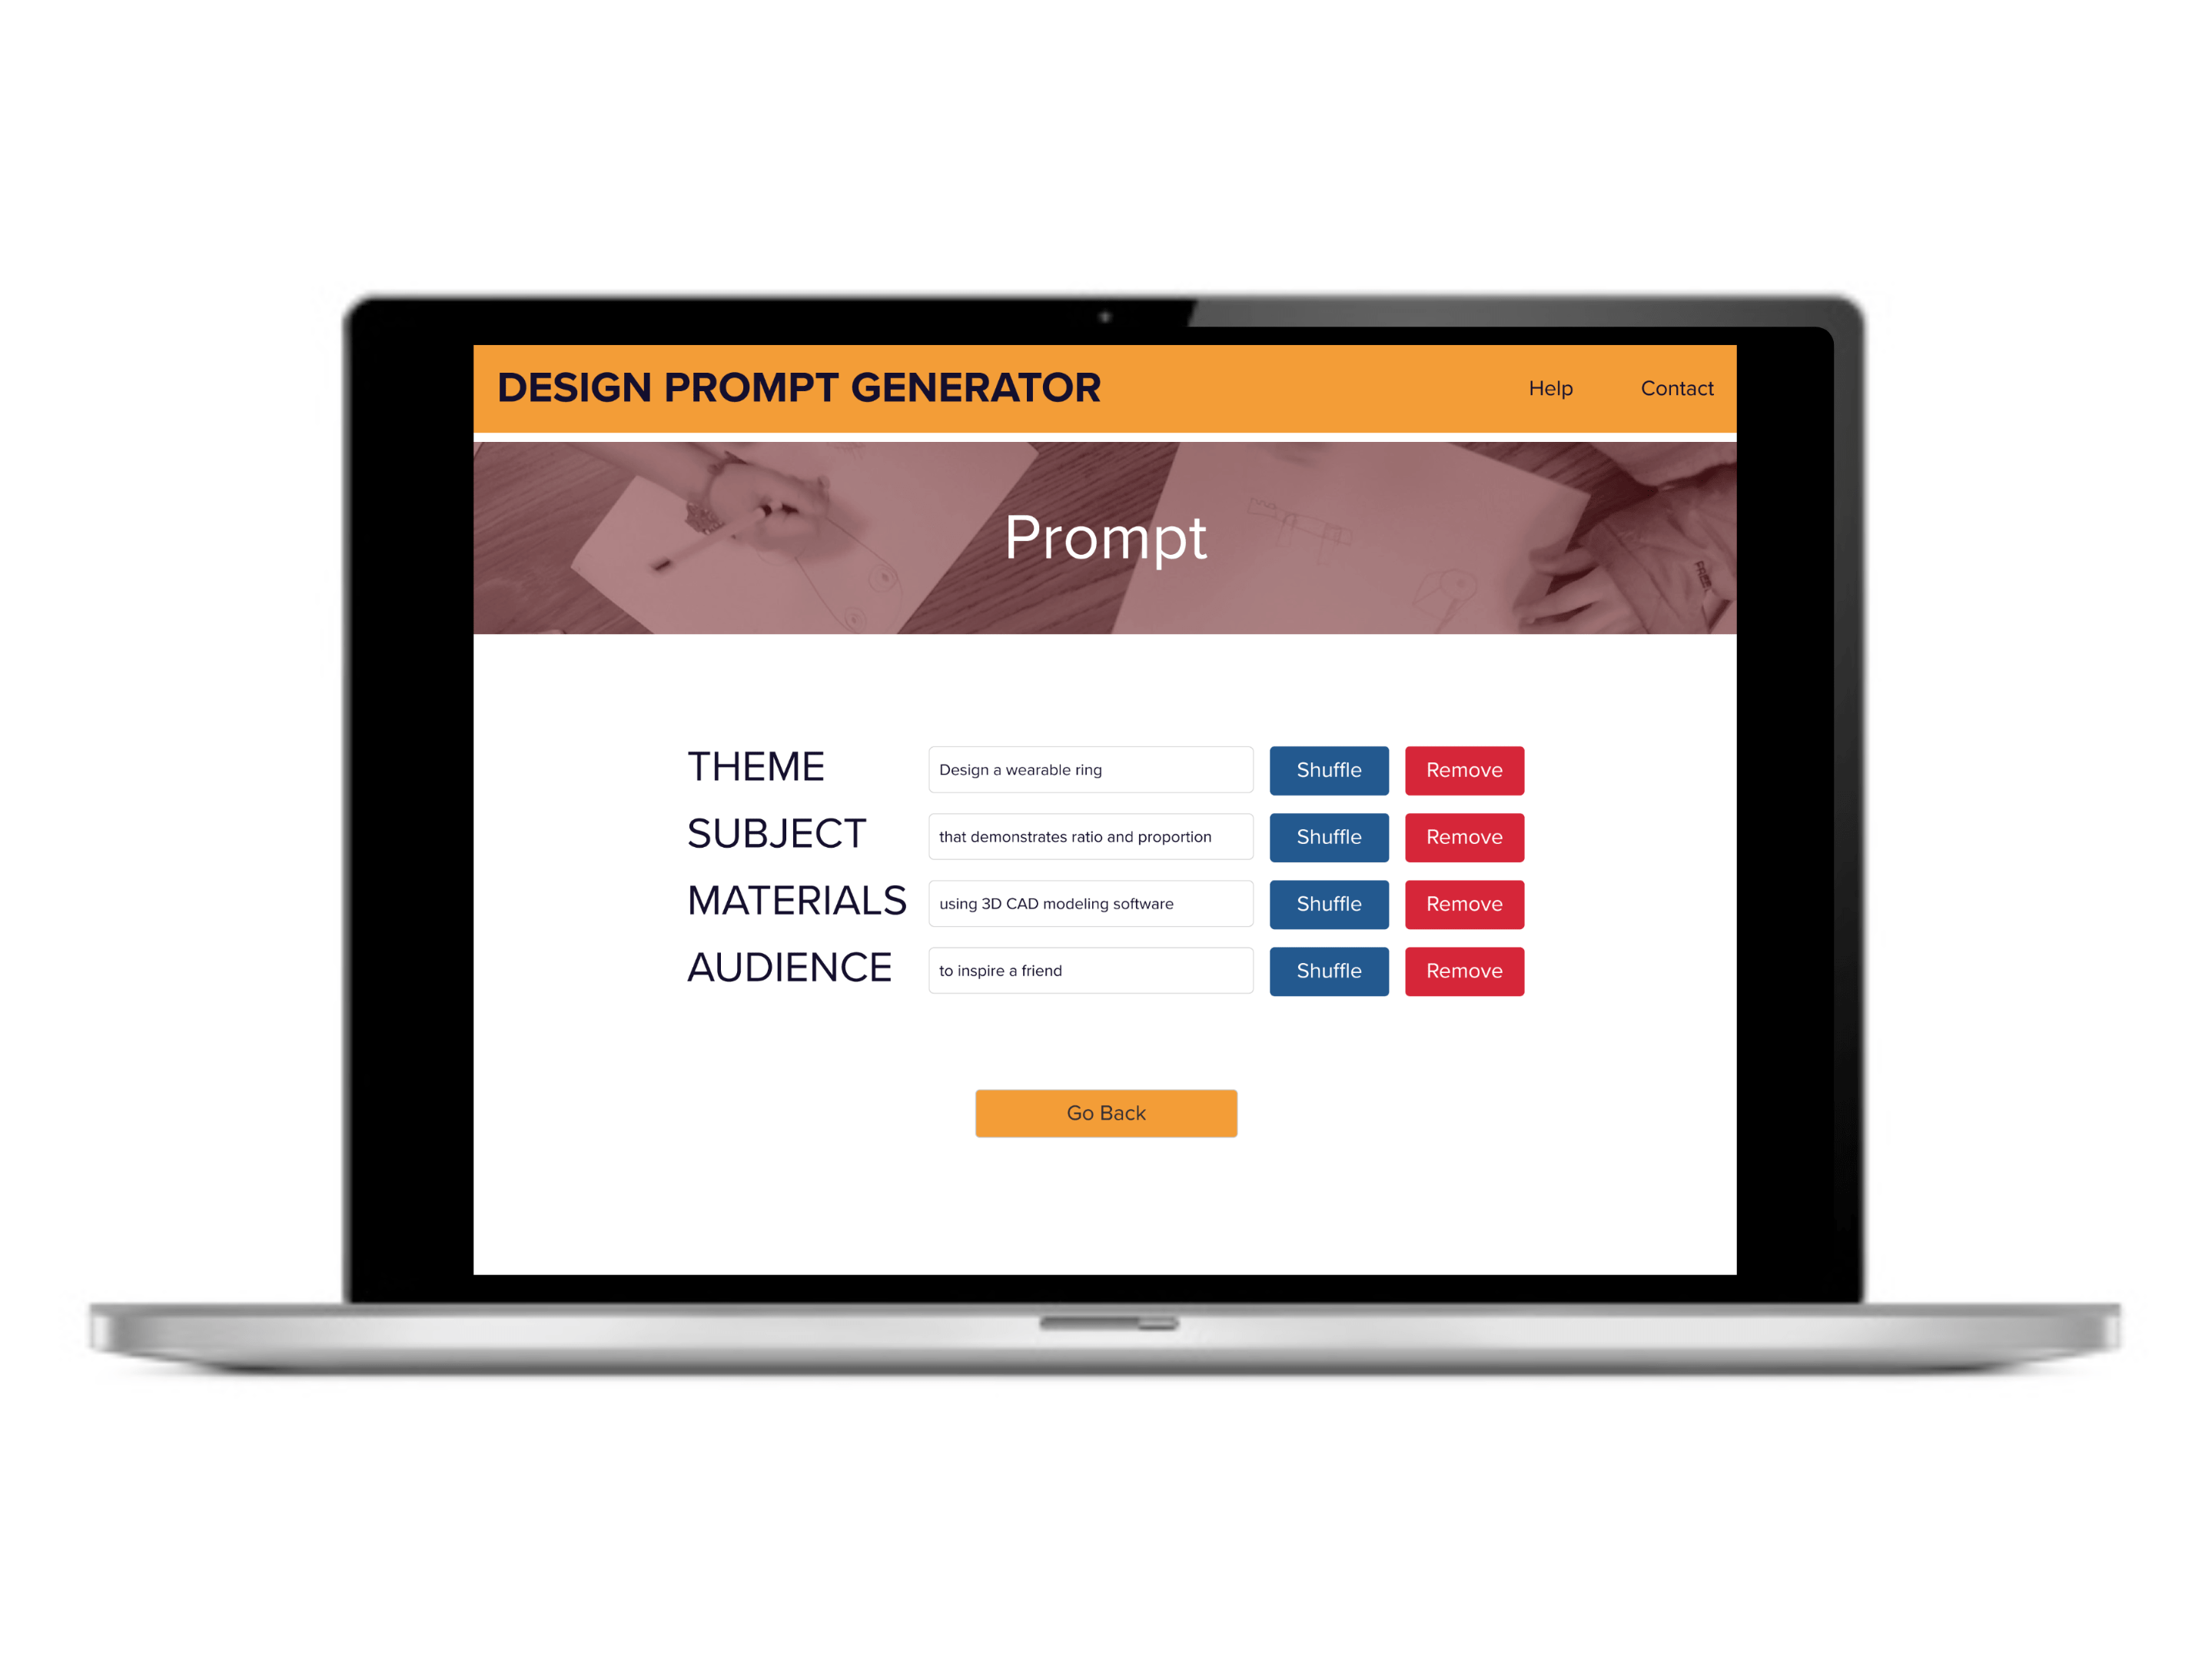
Second, a high-fidelity prototype (Wireframe, Clickable Prototype) was developed in Figma (see Figures 3, 4, and 5) and evaluated according to Web Content Accessibility Guidelines (WCAG). The high-fidelity prototype was tested using unmoderated usability testing with 10 participants using Lookback, which examined participant duration on task and pass/fail for each task. Results indicated:
- 98.57% success rate with only one fail, which the participant was able to self-correct
- 50% of participants spent ≥ 1 minute and 30 seconds to complete the task
Based on the data from the second usability test, I had a 98.57% success rate of meeting the goals and needs of my target user to develop a digital product that easily generates design challenge prompts that educators can use for creative classroom activities. This was a usability increase of 12.5%.
Socializing design research through peer-reviewed publications

OVERVIEW
In addition to UX, I have 10+ years of experience conducting educational research that explores K-12 learning experiences at the intersection of art, craft, design, and STEM. I’m a qualitative specialist with experience in diary studies, ethnography, focus group, interview, observation, and field methods. I also have experience with quantitative methods, including survey design and descriptive statistics. I have presented my research at local, state, national, and international levels.
My research has been published in peer-reviewed journals (15 single-author publications, 52 co-author publications), resulting in 1000+ citations (see Google Scholar profile).
FEATURED PUBLICATIONS
Select Qualitative Studies
| Title & Publication | Year | Method & Process | Tools Used |
| Engineering intersections of STEAM: Maker-centered learning to support teachers’ engineering confidence and connections between design processes S Smith in STEAM Education: An Interdisciplinary Look at Art in the Curriculum, Edited by T Hunter-Doniger & N Walkup Chapter 13, pp. 136-151 | 2024 | Ethnography, Observation, Diary Study, Field Notes, Pre-/Post-test Survey, Deductive Coding, Inter-rater Reliability | Dedoose, Google Sheets |
| Understanding the Impact in University Makerspaces J Linsey, C Forest, R Nagel, W Newstetter, K Talley & S Smith IJAMM, pp. 188-191 | 2023 | Ethnography, Descriptive Statistics | Qualtrics, Excel |
| Exploring Ambiguity Tolerance during the Adoption of Maker-Centered Learning Tools and Strategies S Smith, S Rodriguez TechTrends, pp. 1-15 | 2021 | Ethnography, Observation, Diary Study, Field Notes, Pre-/Post-test Survey, Deductive Coding, Inter-rater Reliability | Dedoose, Google Sheets |
| Analyzing the development of science and mathematics teachers’ maker-centered philosophy and instructional practices S Rodriguez, S Smith, J Harron Contemporary Issues in Technology and Teacher Education 21 (1), pp. 97-125 | 2021 | Ethnography, Diary Study, Deductive Coding, Inter-rater Reliability | Dedoose, Google Sheets |
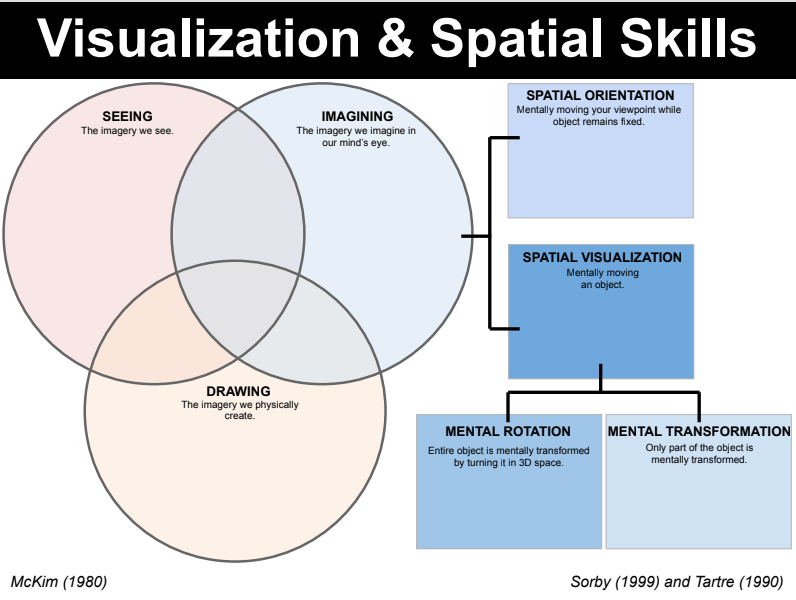
| Children’s Negotiations of Visualization Skills During a Design-Based Learning Experience Using Nondigital and Digital Techniques S Smith Interdisciplinary Journal of Problem-Based Learning 12 (2) | 2018 | Observation, Think Aloud Protocol, Field Notes, Deductive Coding, Member Check | Dedoose |
| Preservice teachers’ beliefs about using maker activities in formal K-12 educational settings: A multi-institutional study WM Jones, S Smith, J Cohen Journal of Research on Technology in Education 49 (3-4), pp. 134-148 | 2017 | Focus Groups, Field Notes, Inductive Coding | Dedoose |
| Fail again, fail better: Embracing failure as a paradigm for creative learning in the arts S Smith, D Henriksen Art Education 69 (2), pp. 6-11 | 2016 | Observation, Diary Study, Field Notes, Member Check | Nvivo |
| (Re) counting meaningful learning experiences: Using student-created reflective videos to make invisible learning visible during PjBL experiences S Smith Interdisciplinary Journal of Problem-Based Learning, 10(1) | 2016 | Ethnography, Observation, Focus Group, Field Notes, Inductive Coding, Peer Debriefers | Audio recording, Transcription, Nvivo |
| Through the teacher’s eyes: Unpacking the TPACK of digital fabrication integration in middle school language arts S Smith Journal of Research on Technology in Education 46 (2), pp. 207-227 | 2013 | Ethnography, Observation, Focus Group, Field Notes, Member Check | Audio recording, Transcription, Nvivo |
Select Quantitative Studies
| Title | Year | Method & Process | Tools Used |
| Report on engineering design self-efficacy and demographics of makerspace participants across three universities EC Hilton, KG Talley, S Smith, RL Nagel, JS Linsey Journal of Mechanical Design 142 (10) | 2020 | Survey, Closed-ended, Likert Scale, Pearson Correlation, ANOVA | Qualtrics, Excel, SPSS |
| University makerspaces: more than just toys EC Hilton, S Smith, RL Nagel, JS Linsey, KG Talley International Design Engineering Technical Conferences and Computers and Information in Engineering Conference | 2018 | Survey, Closed-ended, Likert Scale, Pearson Correlation, ANOVA | Qualtrics, Excel, SPSS |
| ‘‘Lend a Hand’’Project Helps Students: Improved Spatial Visualization Skills Through Engaging in Hands-On 3-D Printed Prosthetics Project During a 9th Grade Engineering Course S Smith, K Talley Journal of Pre-College Engineering Education Research (J-PEER) 8 (1) | 2018 | Ethnography, Observation, Course Grades, Pre-/Post-test Survey, Closed-ended, Likert Scale, paired t-test, Mann Whitney U-test | Excel, SPSS |
| Art ed maker pd experience: Impacts of an immersive professional development for “making” STEM connections in K-12 art classrooms S Smith, J Van Overshelde, & T Evans-Palmer In L. Lui, & D. Gibson (Eds.), Research highlights in technology and teacher education, pp.173-182 | 2018 | Observation, Focus Group, Pre-/Post-test Survey, Closed-ended, Likert Scale, t-test | Nvivo, Excel, SPSS |
Select Best Practices & Theory Publications
| Title | Year |
| Makification: Towards a framework for leveraging the maker movement in formal education J Cohen, WM Jones, S Smith, B Calandra Journal of Educational Multimedia and Hypermedia 26 (3), pp. 217-229 | 2017 |
| Programming multimedia stories in Scratch to integrate computational thinking and writing with elementary students S Smith, LE Burrow Journal of Mathematics Education 9 (2), pp. 119-131 | 2016 |
| Robo/graphy: Using practical arts-based robots to transform classrooms into makerspaces PN Robbins, S Smith Art Education 69 (3), pp. 44-51 | 2016 |
My resume and CV are available upon request or you can connect with me on LinkedIn.
Creating The MAKE Lab mobile makerspace initiative, branding, strategy, and website
Project Overview
The MAKE Lab (Making Awesome Knowledge-building Experiences) was established as a mobile makerspace to address equity gaps in access to design-based learning. I spearheaded the initiative when I was an Assistant Professor of Educational Technology at Texas State University, which successfully mentored university students while delivering free, hands-on creative learning workshops to underserved communities across Central Texas. The project’s success was underpinned by robust branding, strategic marketing for fundraising, and the development of a website that served as a permanent online resource repository.
Impact: Designed and implemented a comprehensive program that mentored 79 university students and raised $75,000 over seven years, enabling them to provide 2,480 hours of service for 1,405 local community members in 6 cities across Central Texas and 8 countries globally.
1. The Challenge and Opportunity
Challenge: At the time, access to high-quality makerspace tools and design-based learning activities was largely confined to affluent school districts and private institutions. Simultaneously, pre-service university students (i.e., students majoring in education with the goal of becoming teachers) required experiential learning opportunities to help them master developing and facilitating complex, multidisciplinary instructional activities.
Opportunity: I saw this as an opportunity to create a scalable, mobile solution to bridge this access gap while simultaneously using participatory action research (PAR) and service-learning models to provide university students with real-world pedagogical training. This approach would turn university students into co-developers and facilitators of content.
2. Solution: The Mobile MAKE Lab and Curriculum
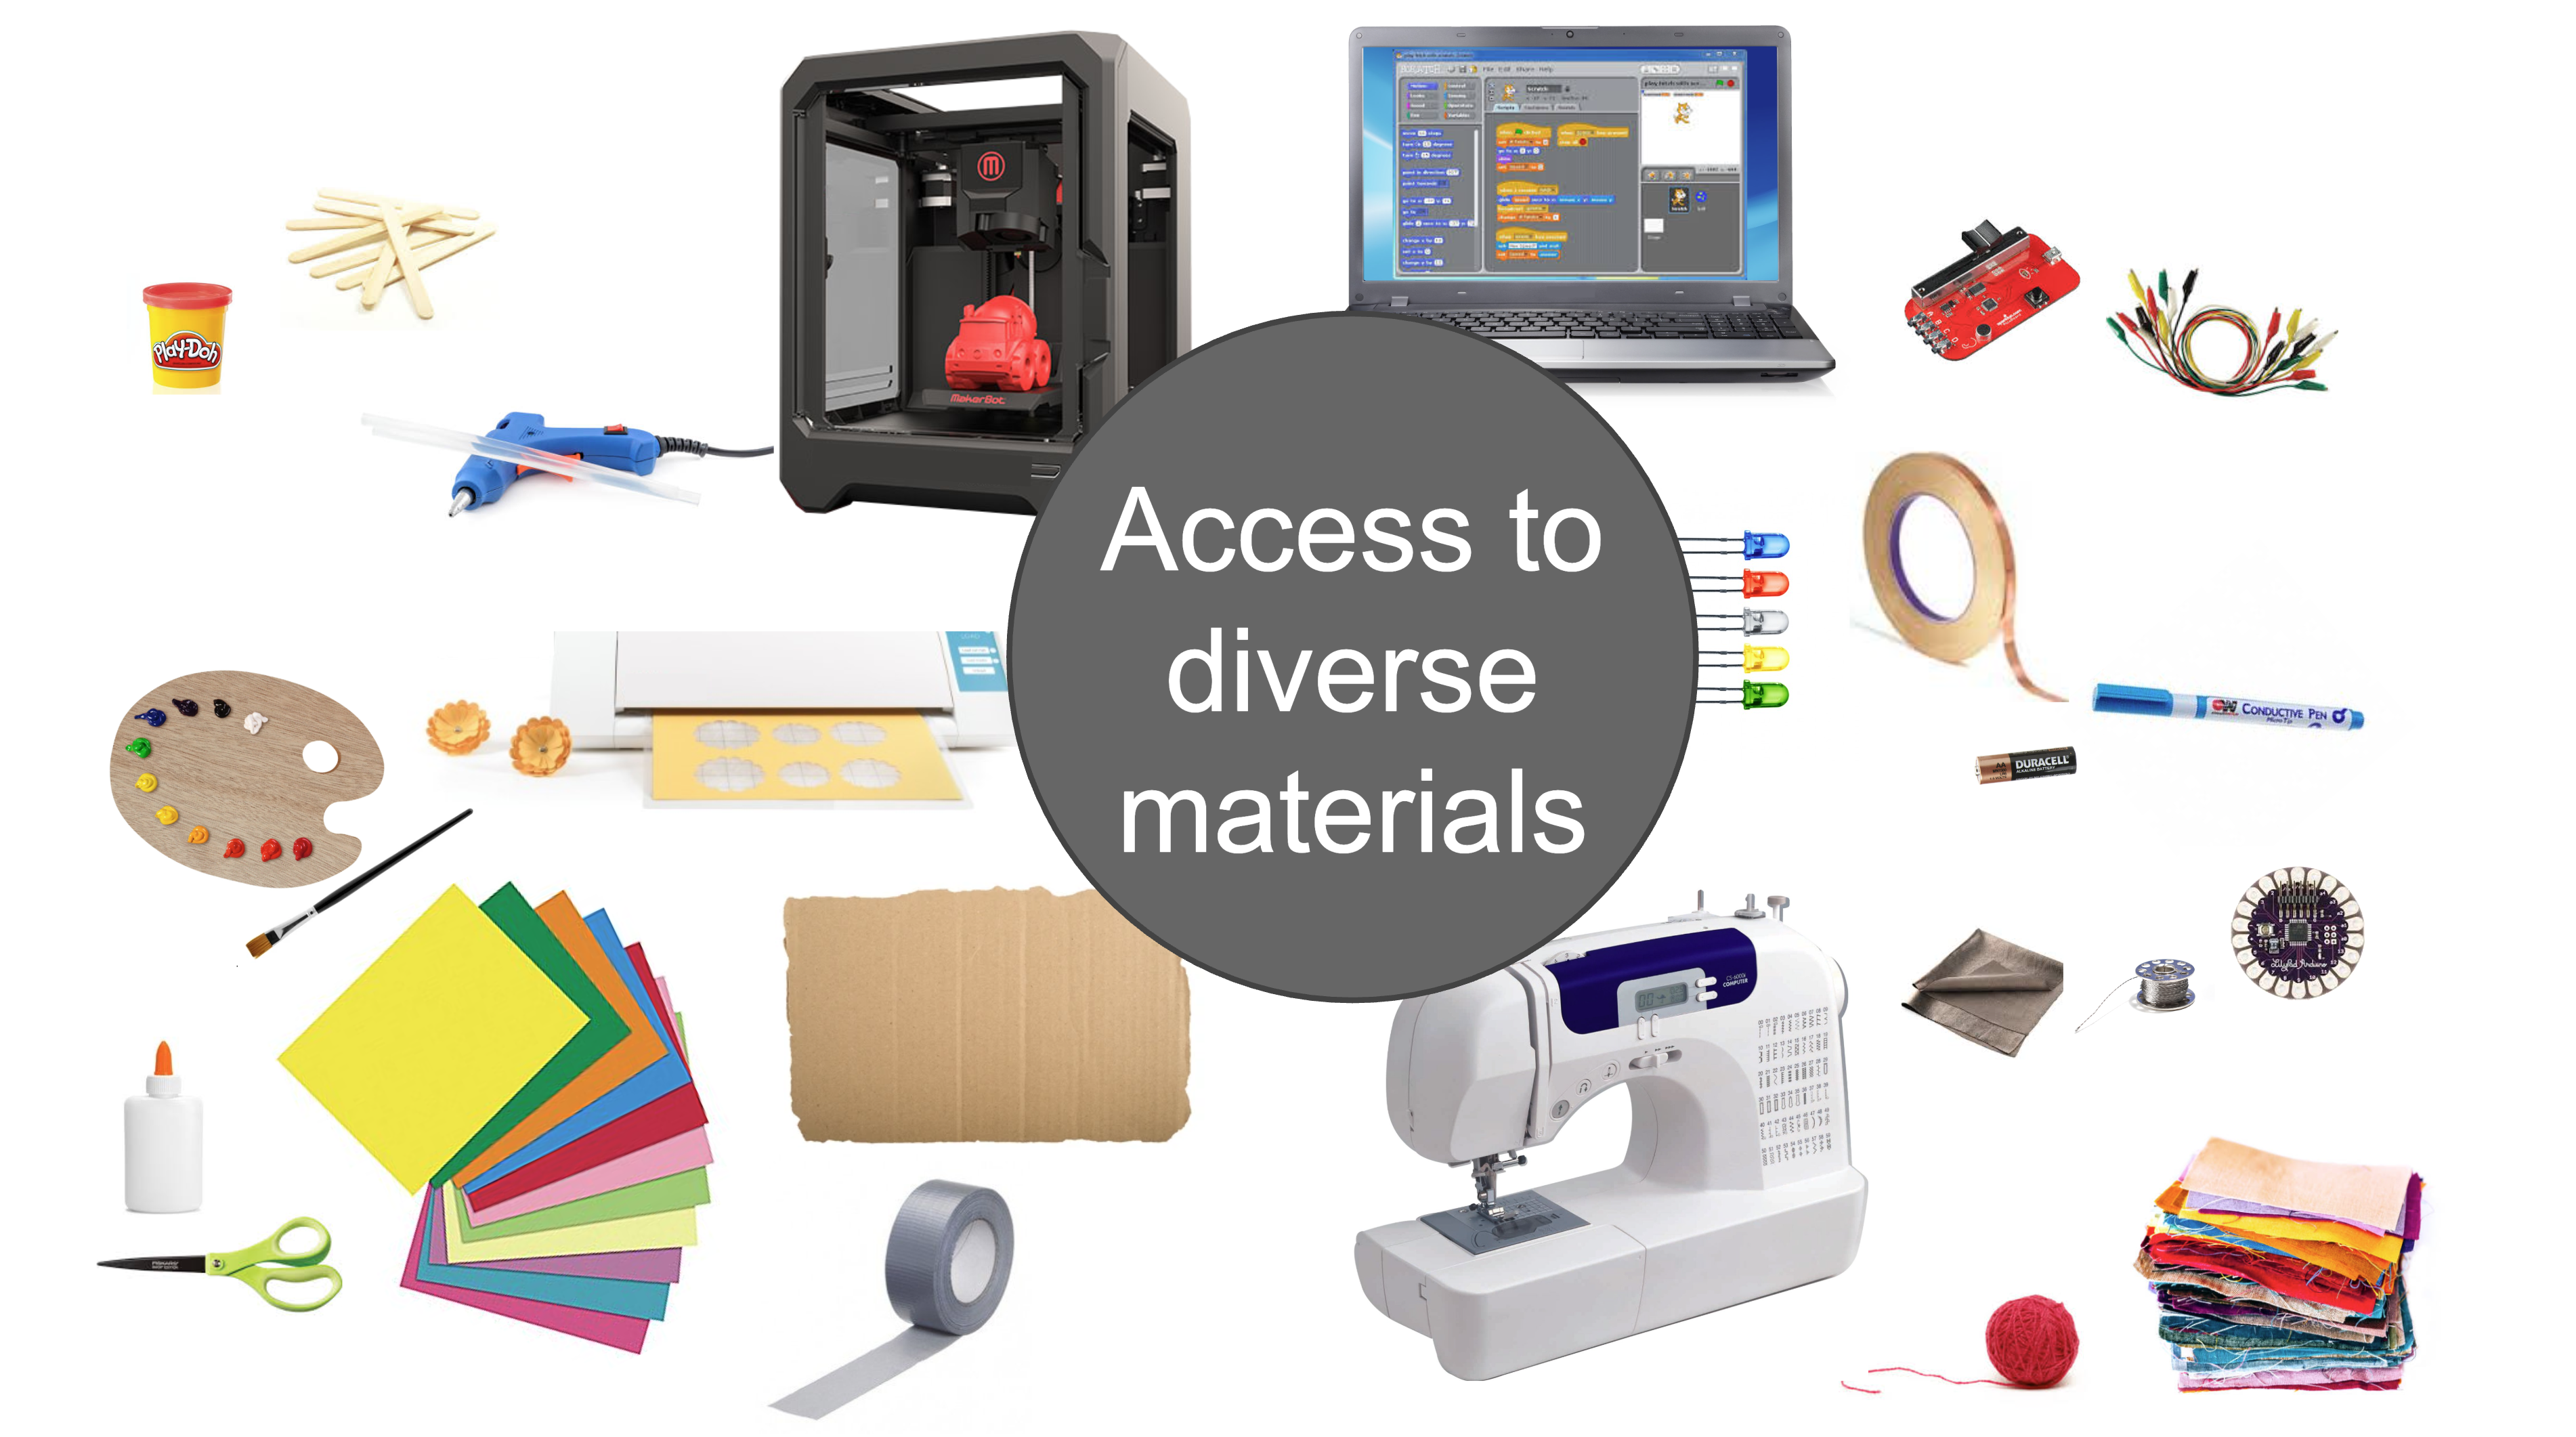
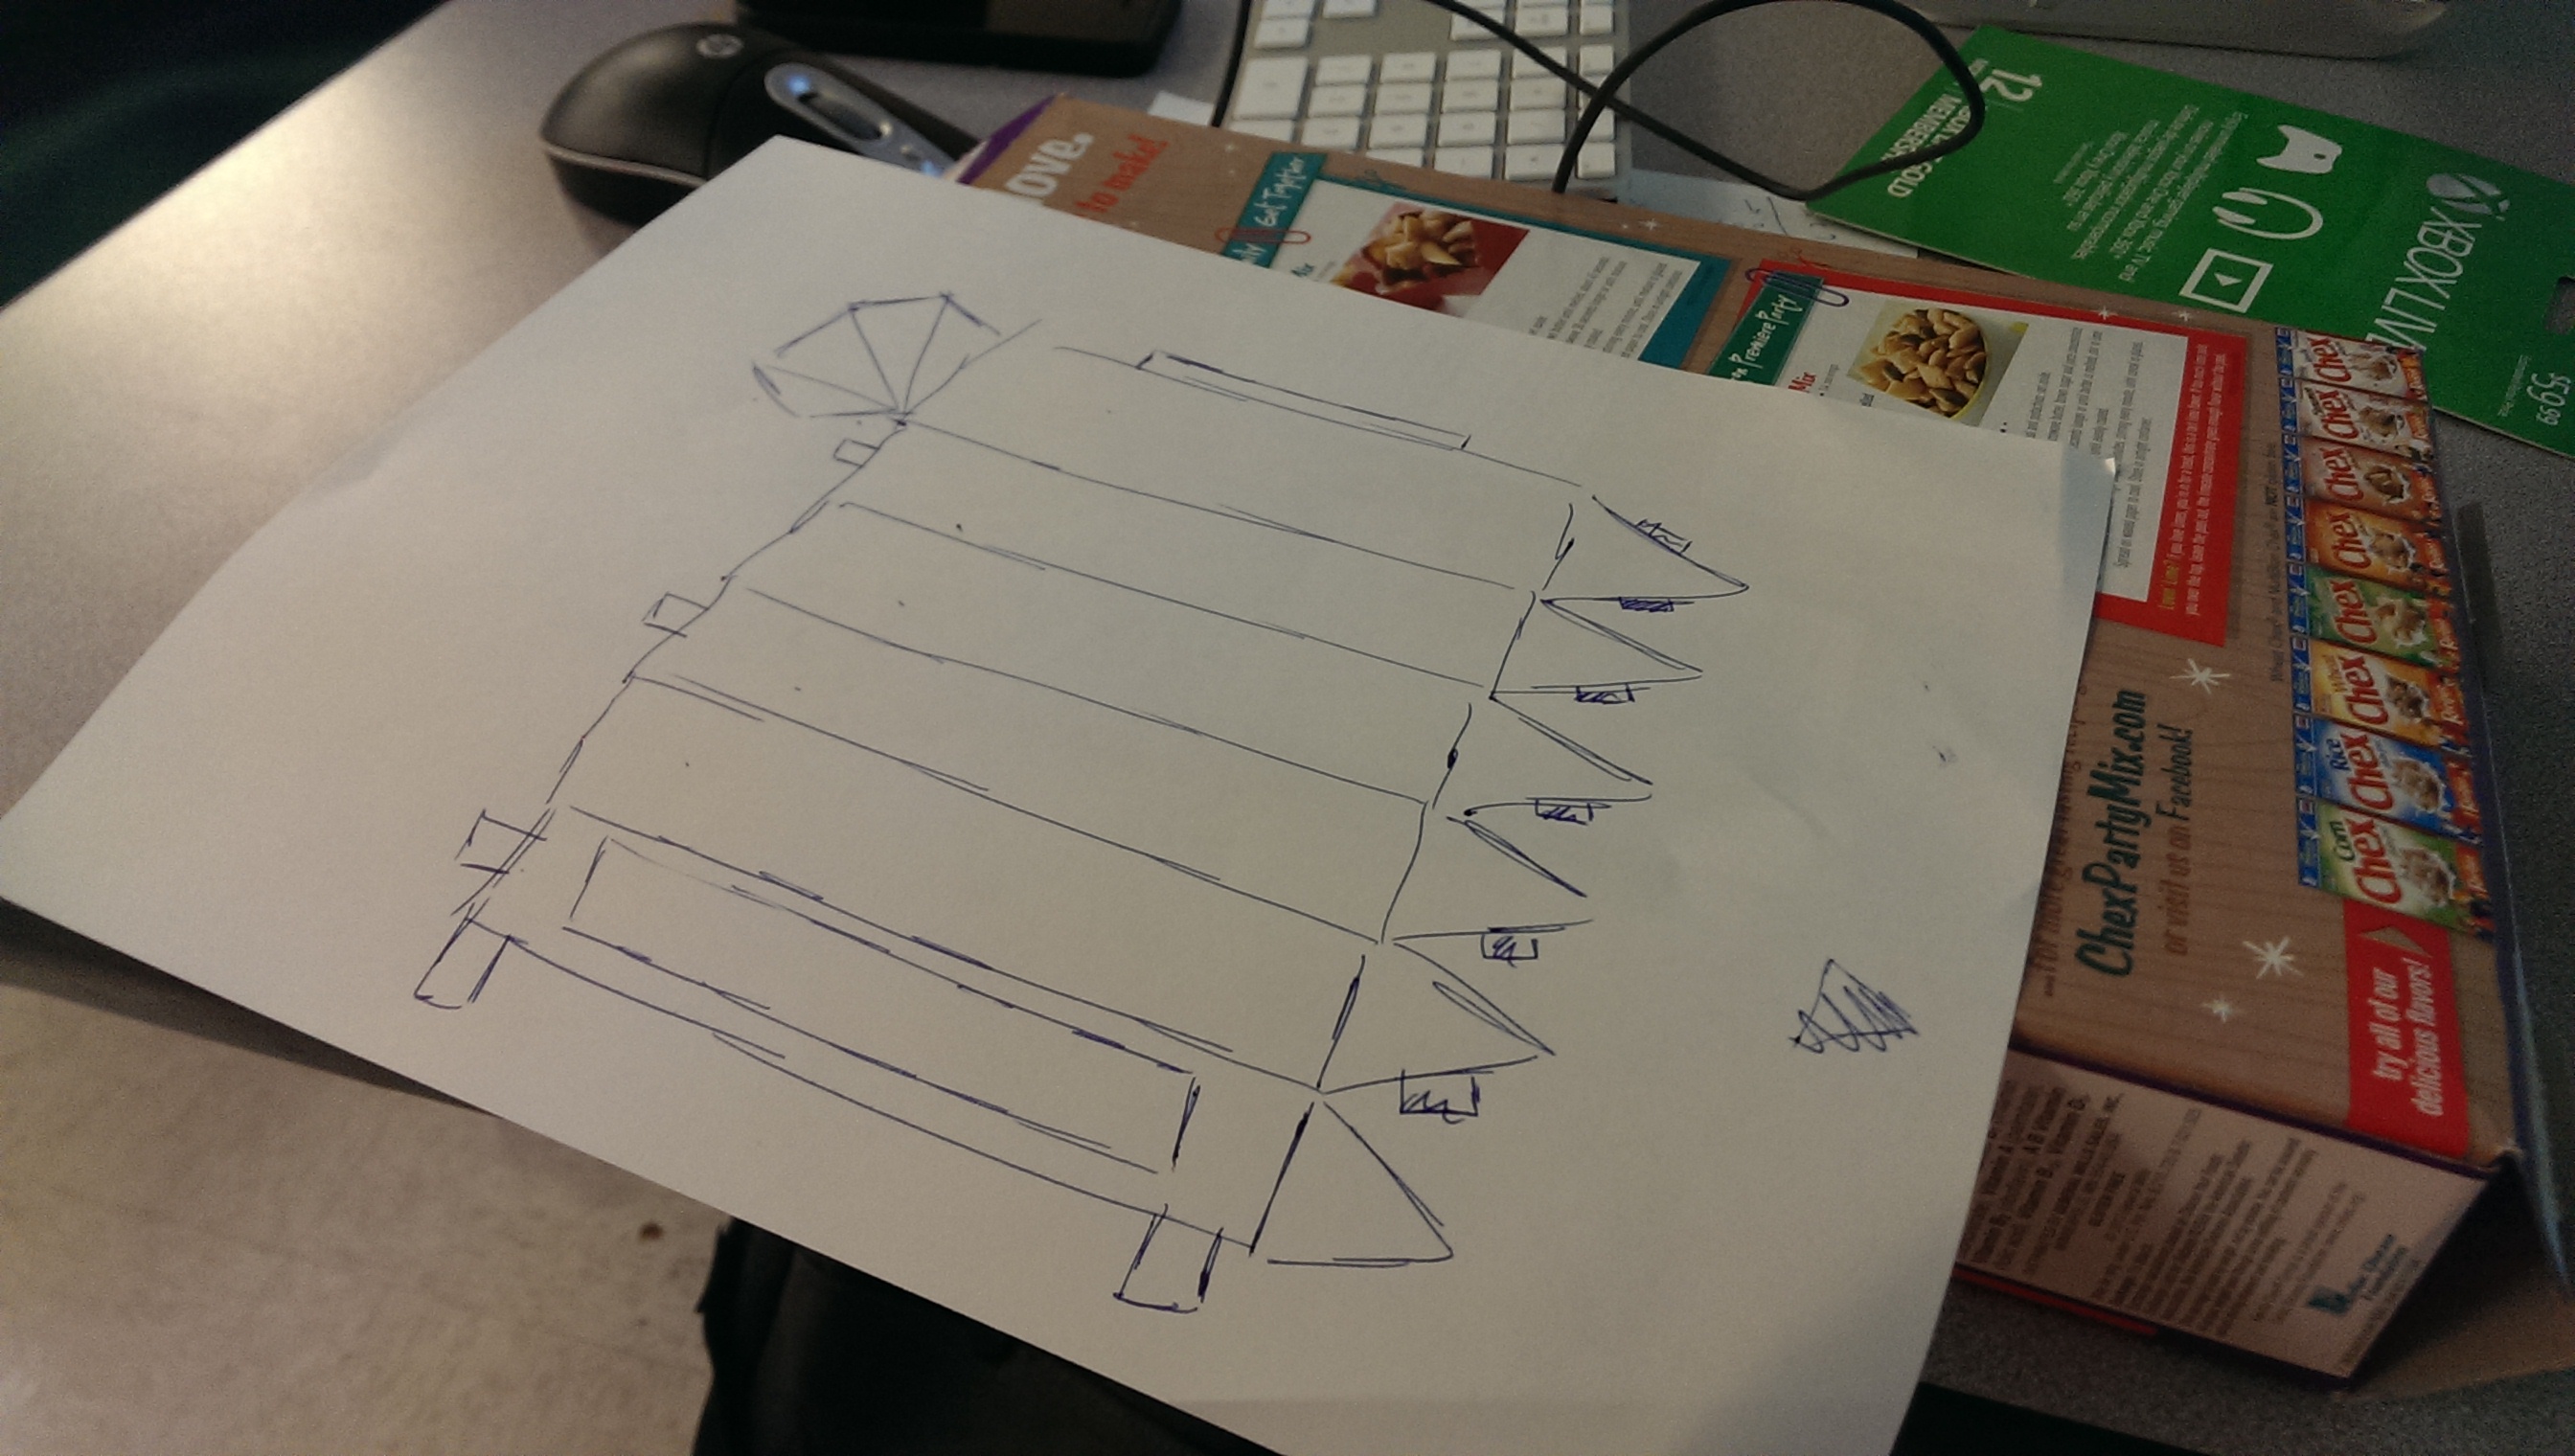
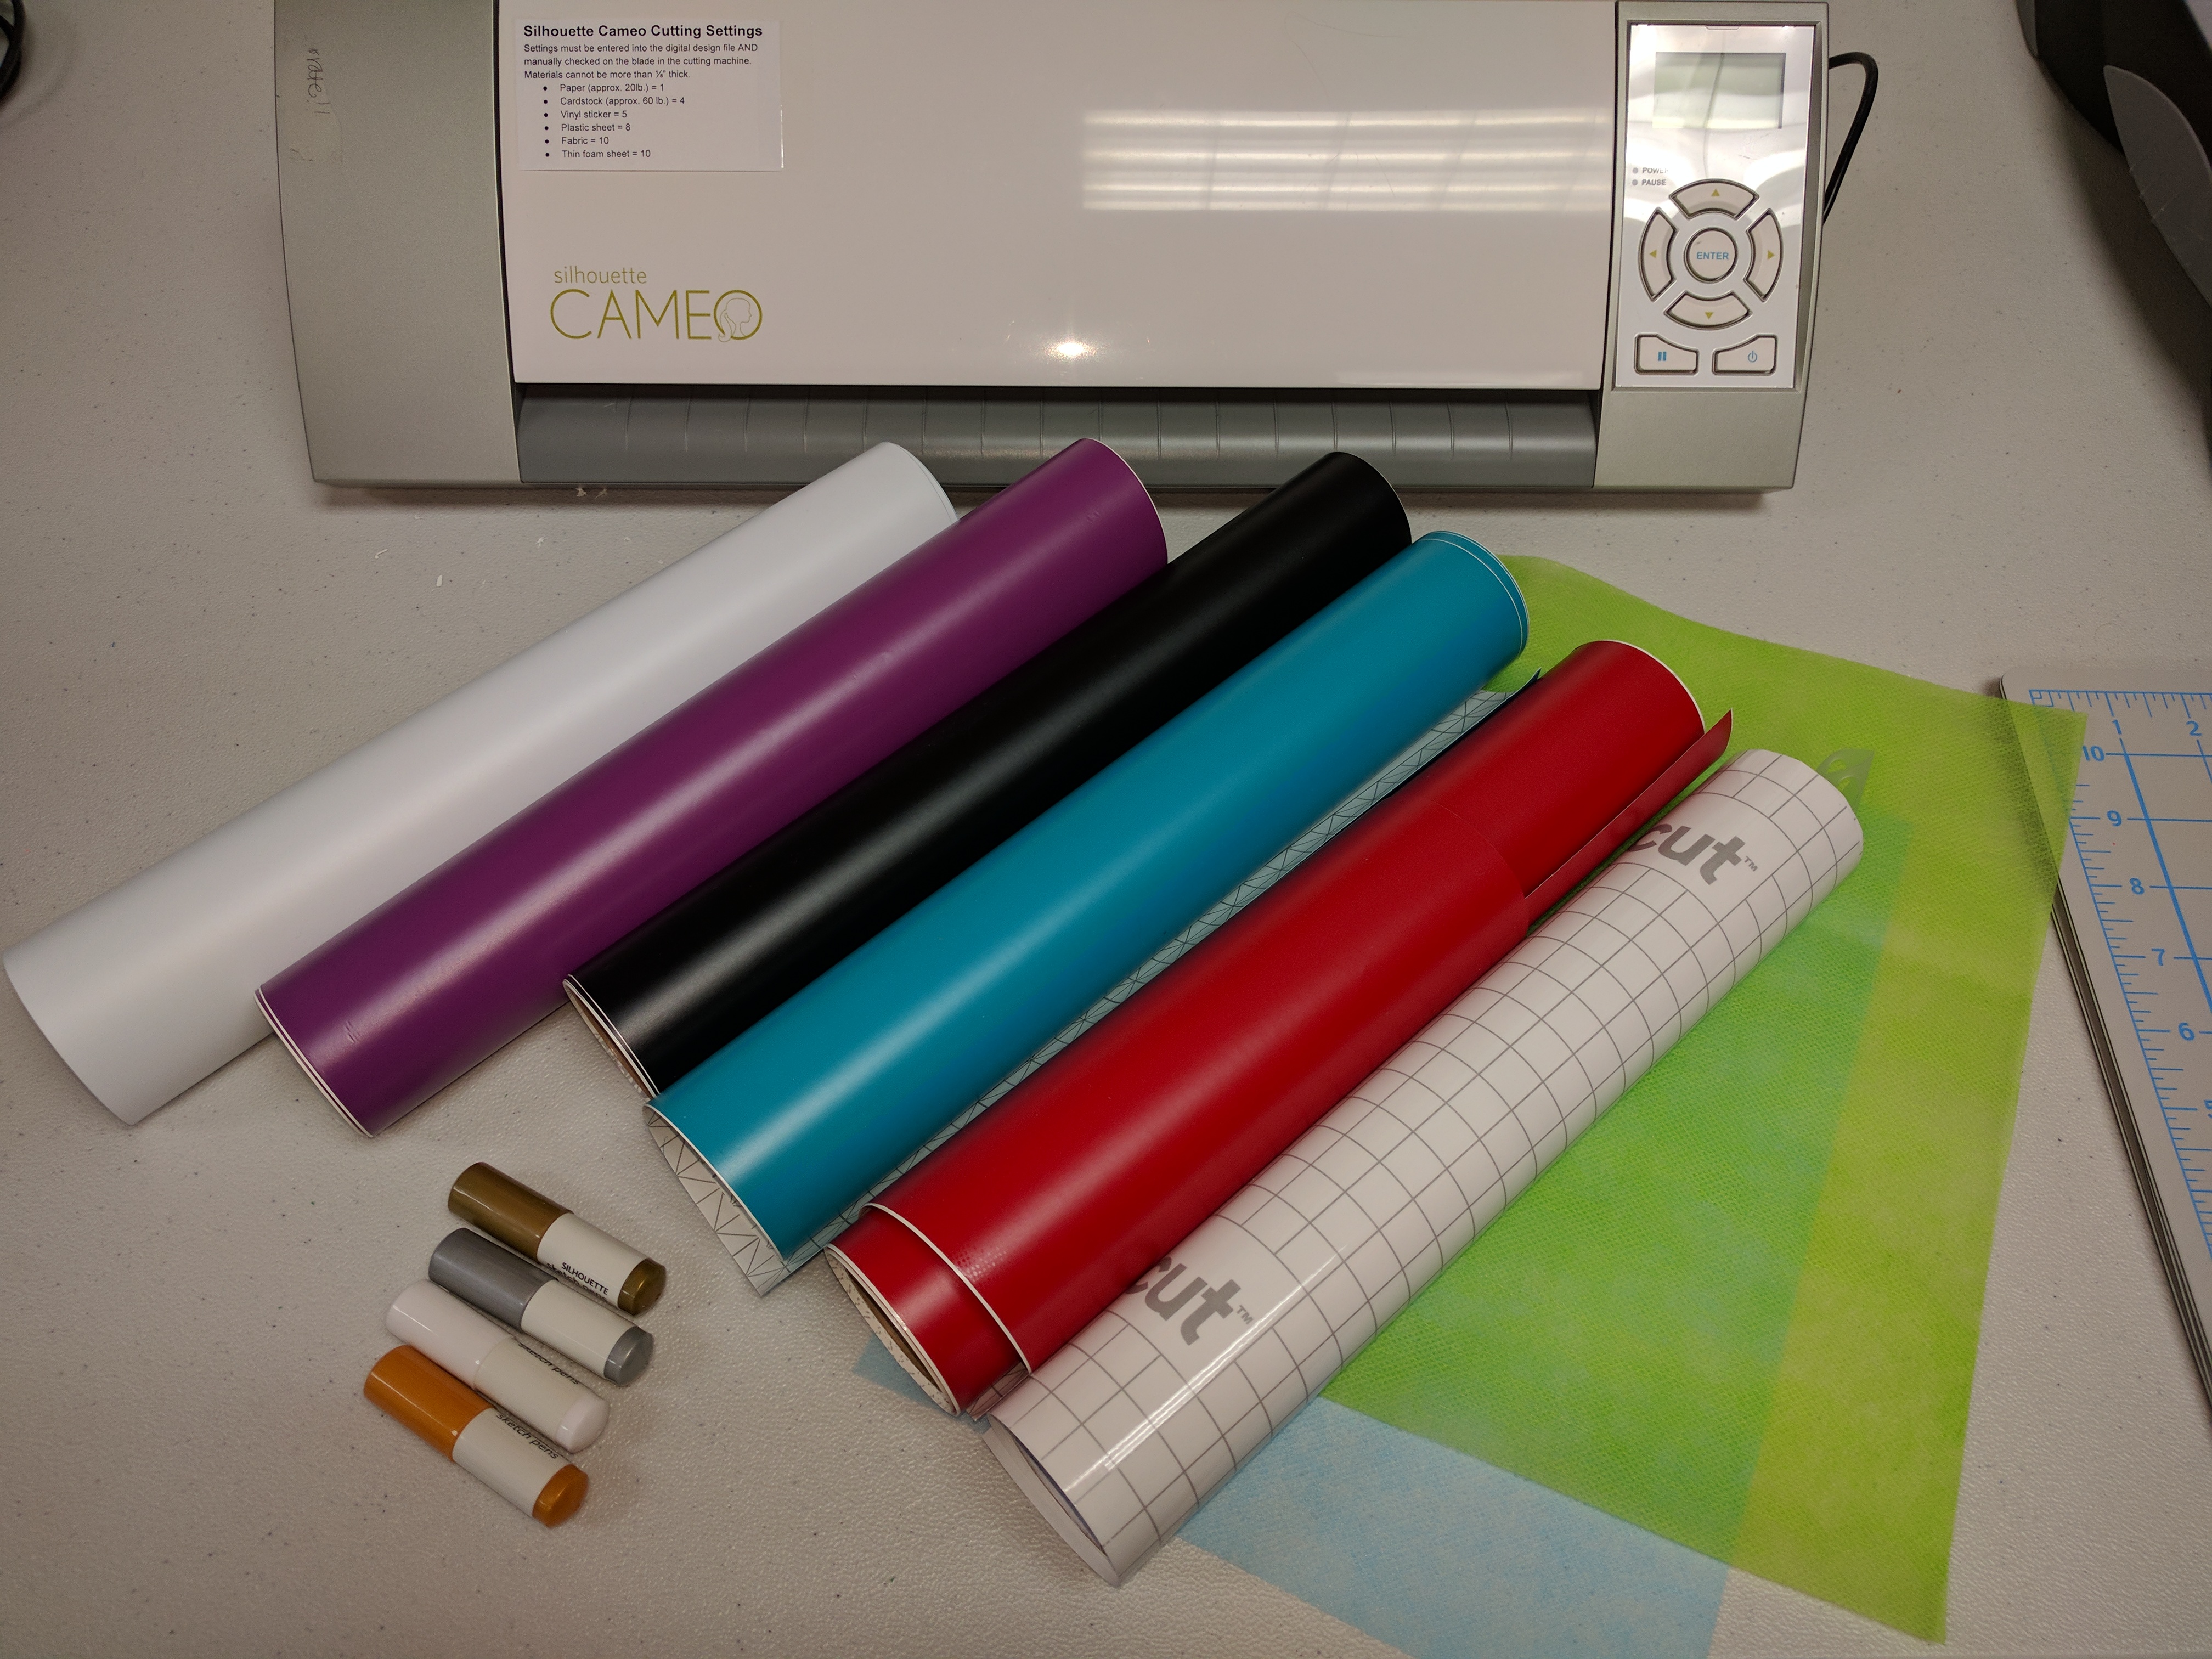
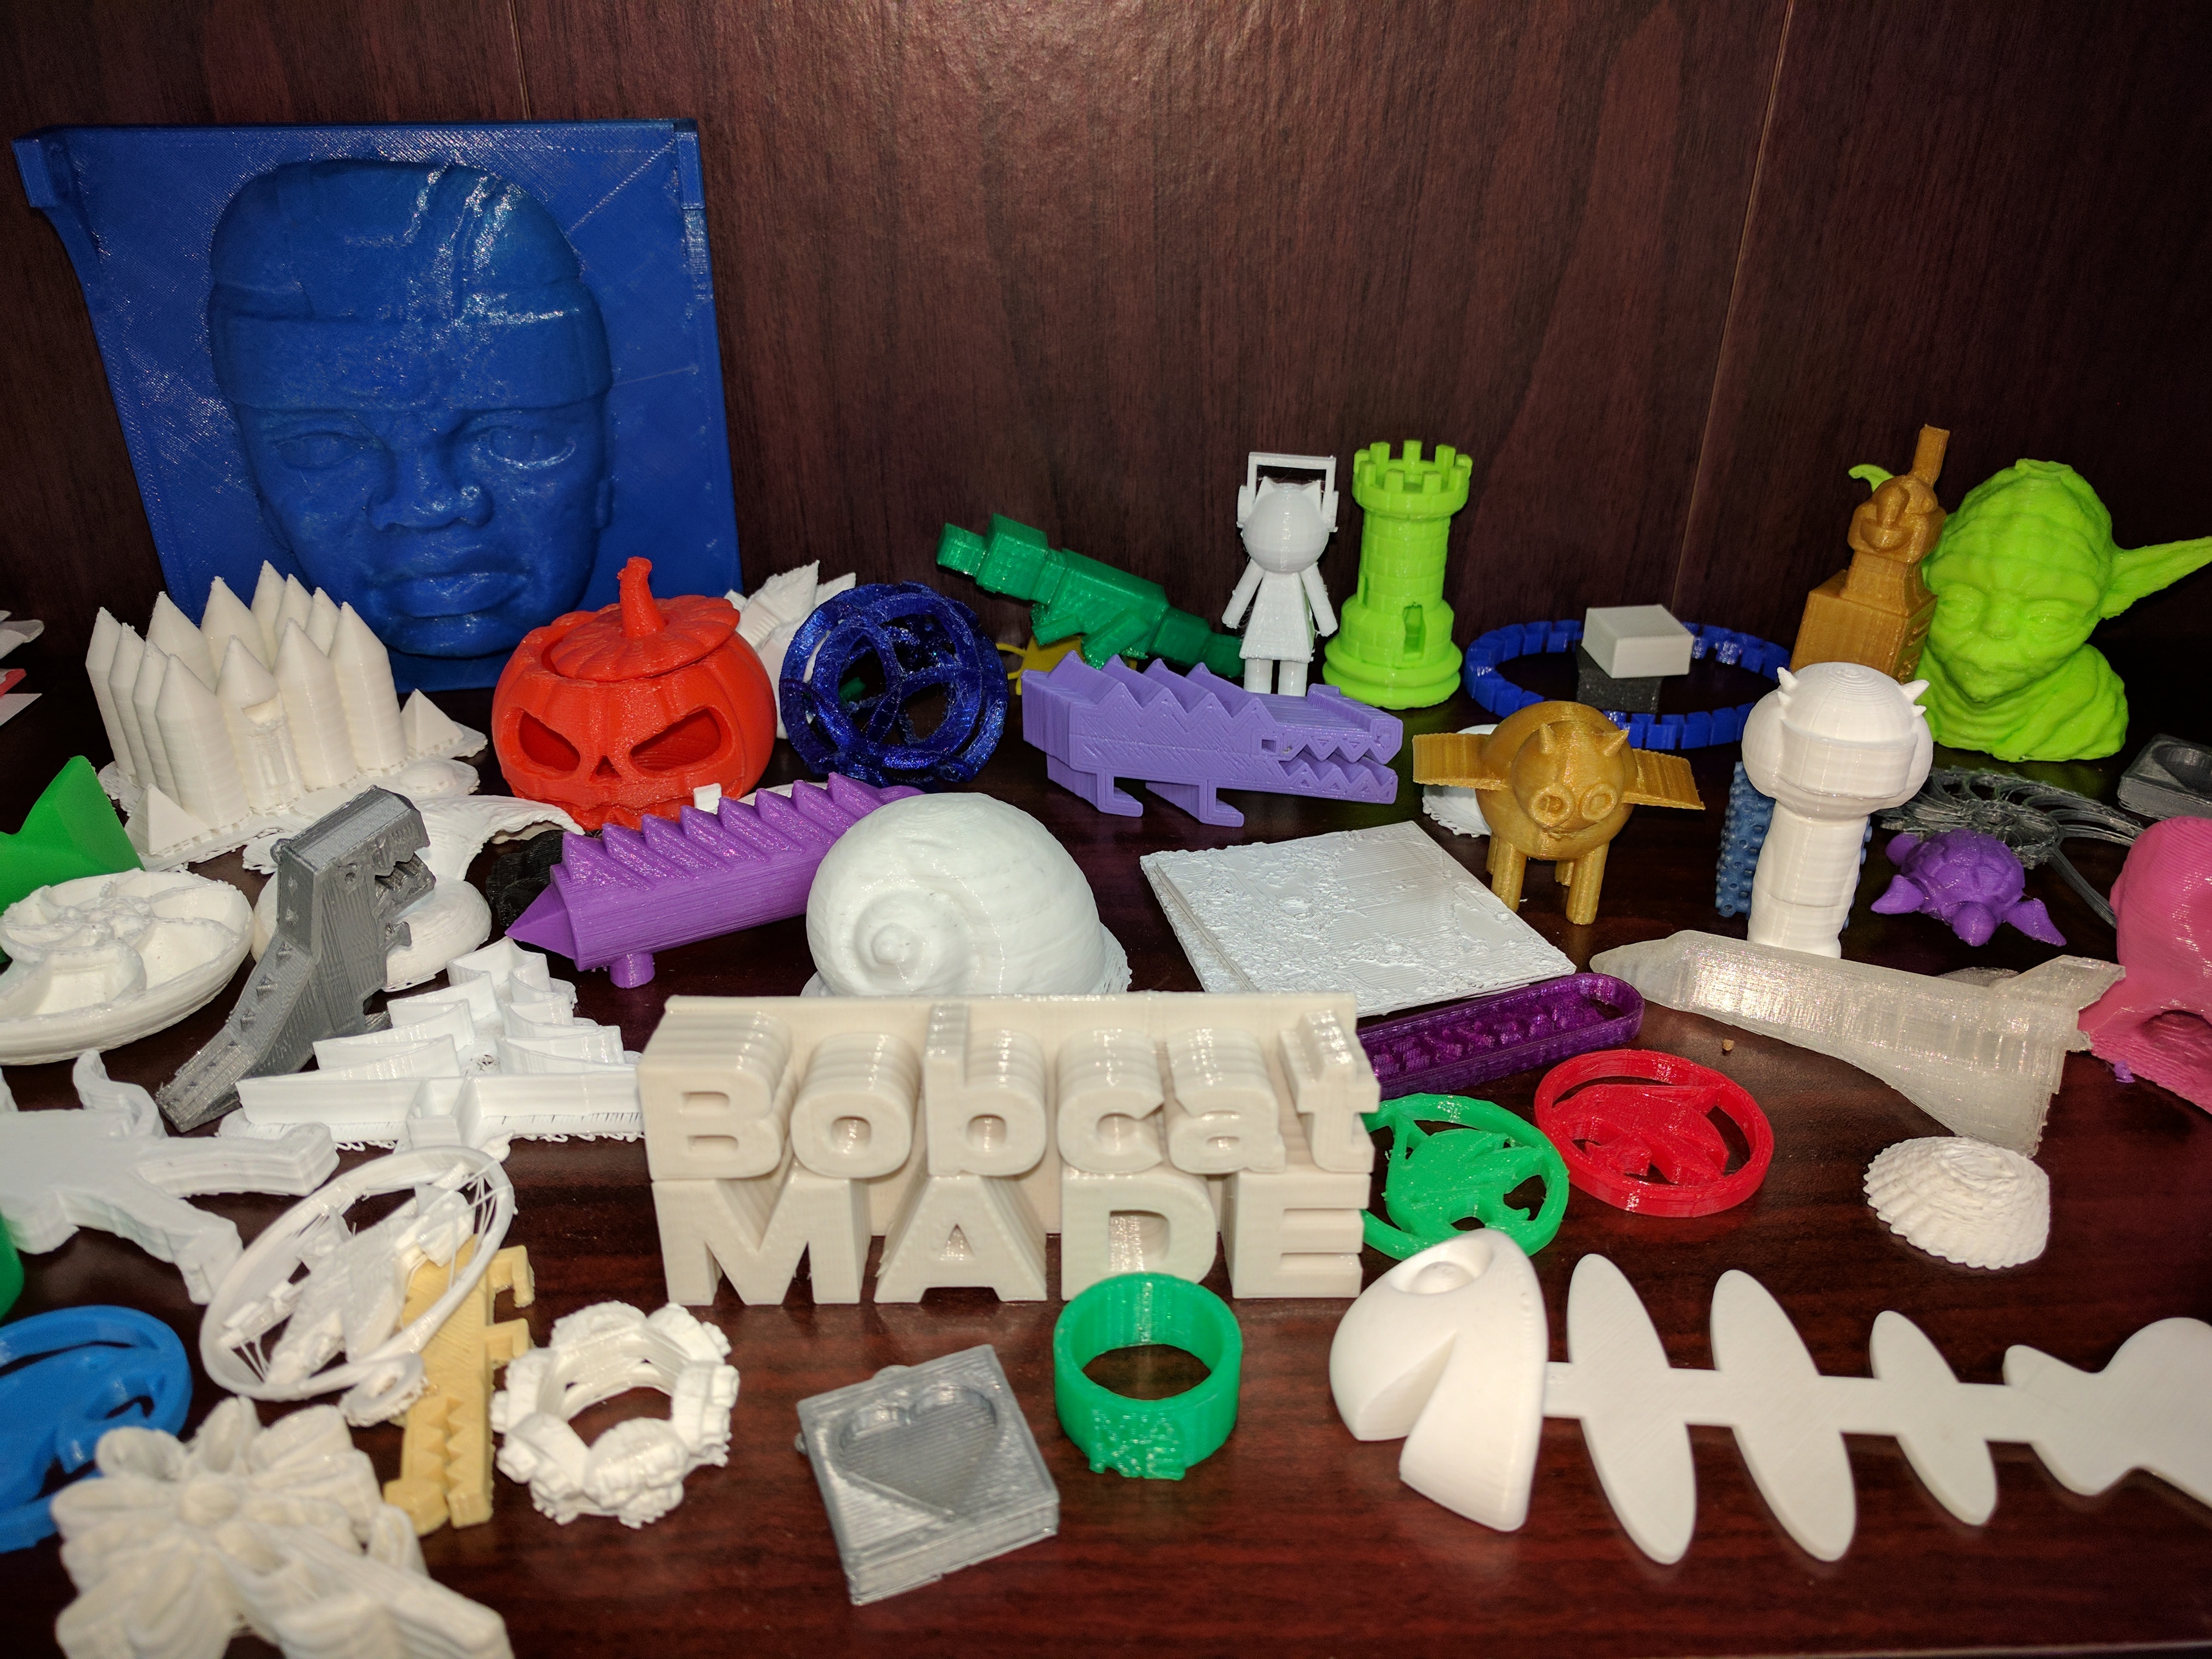
As the program leader, I developed the curriculum and coursework that formed the foundation of the MAKE Lab experience. The core solution involved equipping a mobile lab with diverse makerspace tools and materials (e.g., upcycling materials, common craft materials, circuit components, 3D printers, paper/vinyl cutting machines, laptops for digital design and coding) and using it as a vehicle for community engagement.
University students were mentored through a design-thinking process:
- Design & Iteration: After receiving training in design-based learning strategies, materials, and tools, university students applied their prior knowledge and content area specializations to create original, hands-on design activities. These were rigorously tested in class with classmates prior to deploying in the community, ensuring they were age-appropriate, safe, and inspired a range of creativity.
- Community Facilitation: Activities were implemented through free workshops hosted at local libraries, cultural centers, and K-12 schools. Participant feedback was collected throughout the experiences in the form of diary studies, interviews, and exit ticket reflections.
- Reflection & Curation: Following events, students engaged in PAR by reflecting on community participant engagement, lessons learned, and recommended activity iterations.
3. Branding, Marketing, and Funding Strategy
A critical component of the MAKE Lab’s long-term viability was establishing a compelling brand identity to spread the word, attract donations, and secure external funding.
Naming & Identity
The name, The MAKE Lab, was chosen to convey the dual mission of the program: Making Awesome Knowledge-building Experiences. The philosophy valued both structured, criteria-focused design (i.e., strategic learning of elements and principles or design and/or multidisciplinary content concepts) and unstructured, playful tinkering (i.e., serendipitous learning, artistic expression). The playful nature of the activities was emphasized in the tagline: “proceed with curiosity and MAKE something awesome.”
Marketing Materials and Fundraising
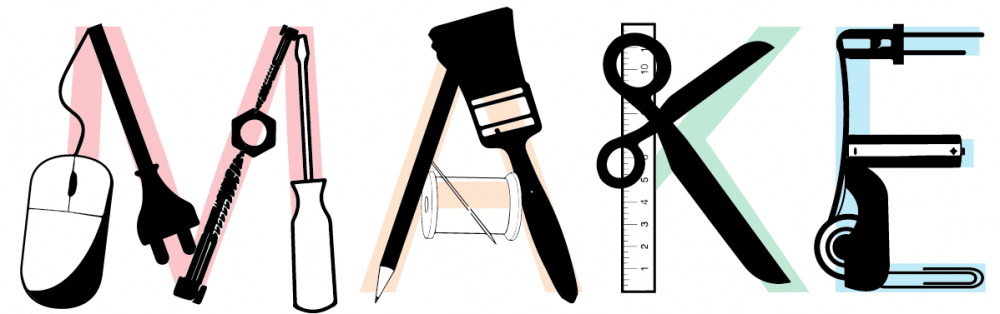
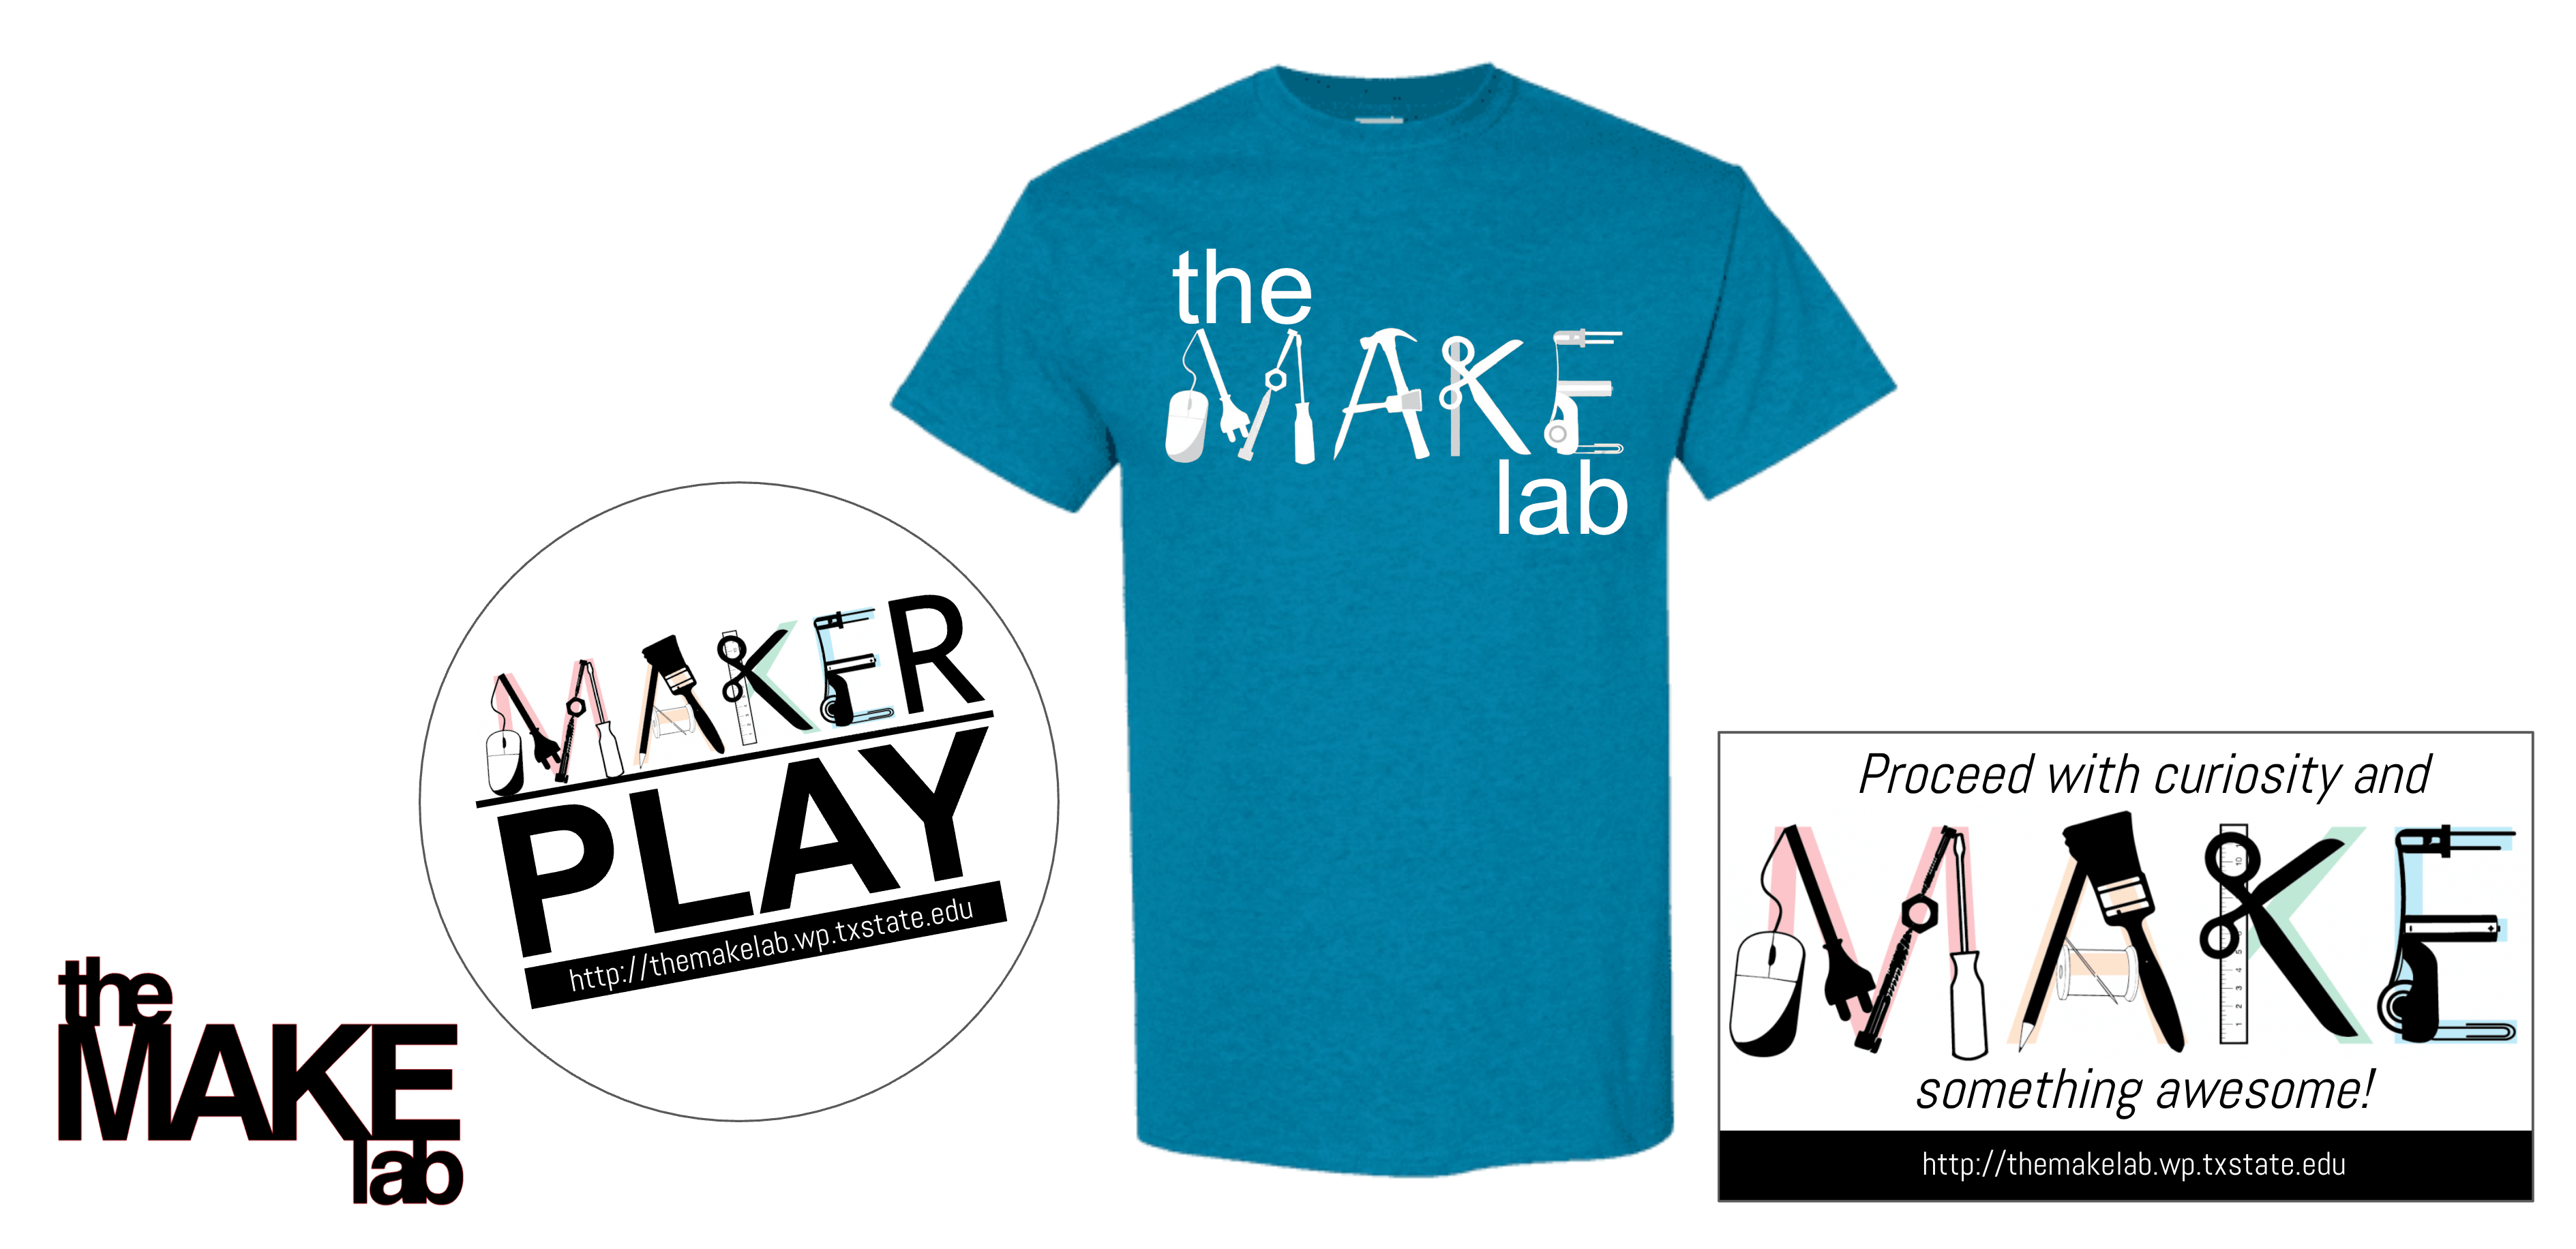
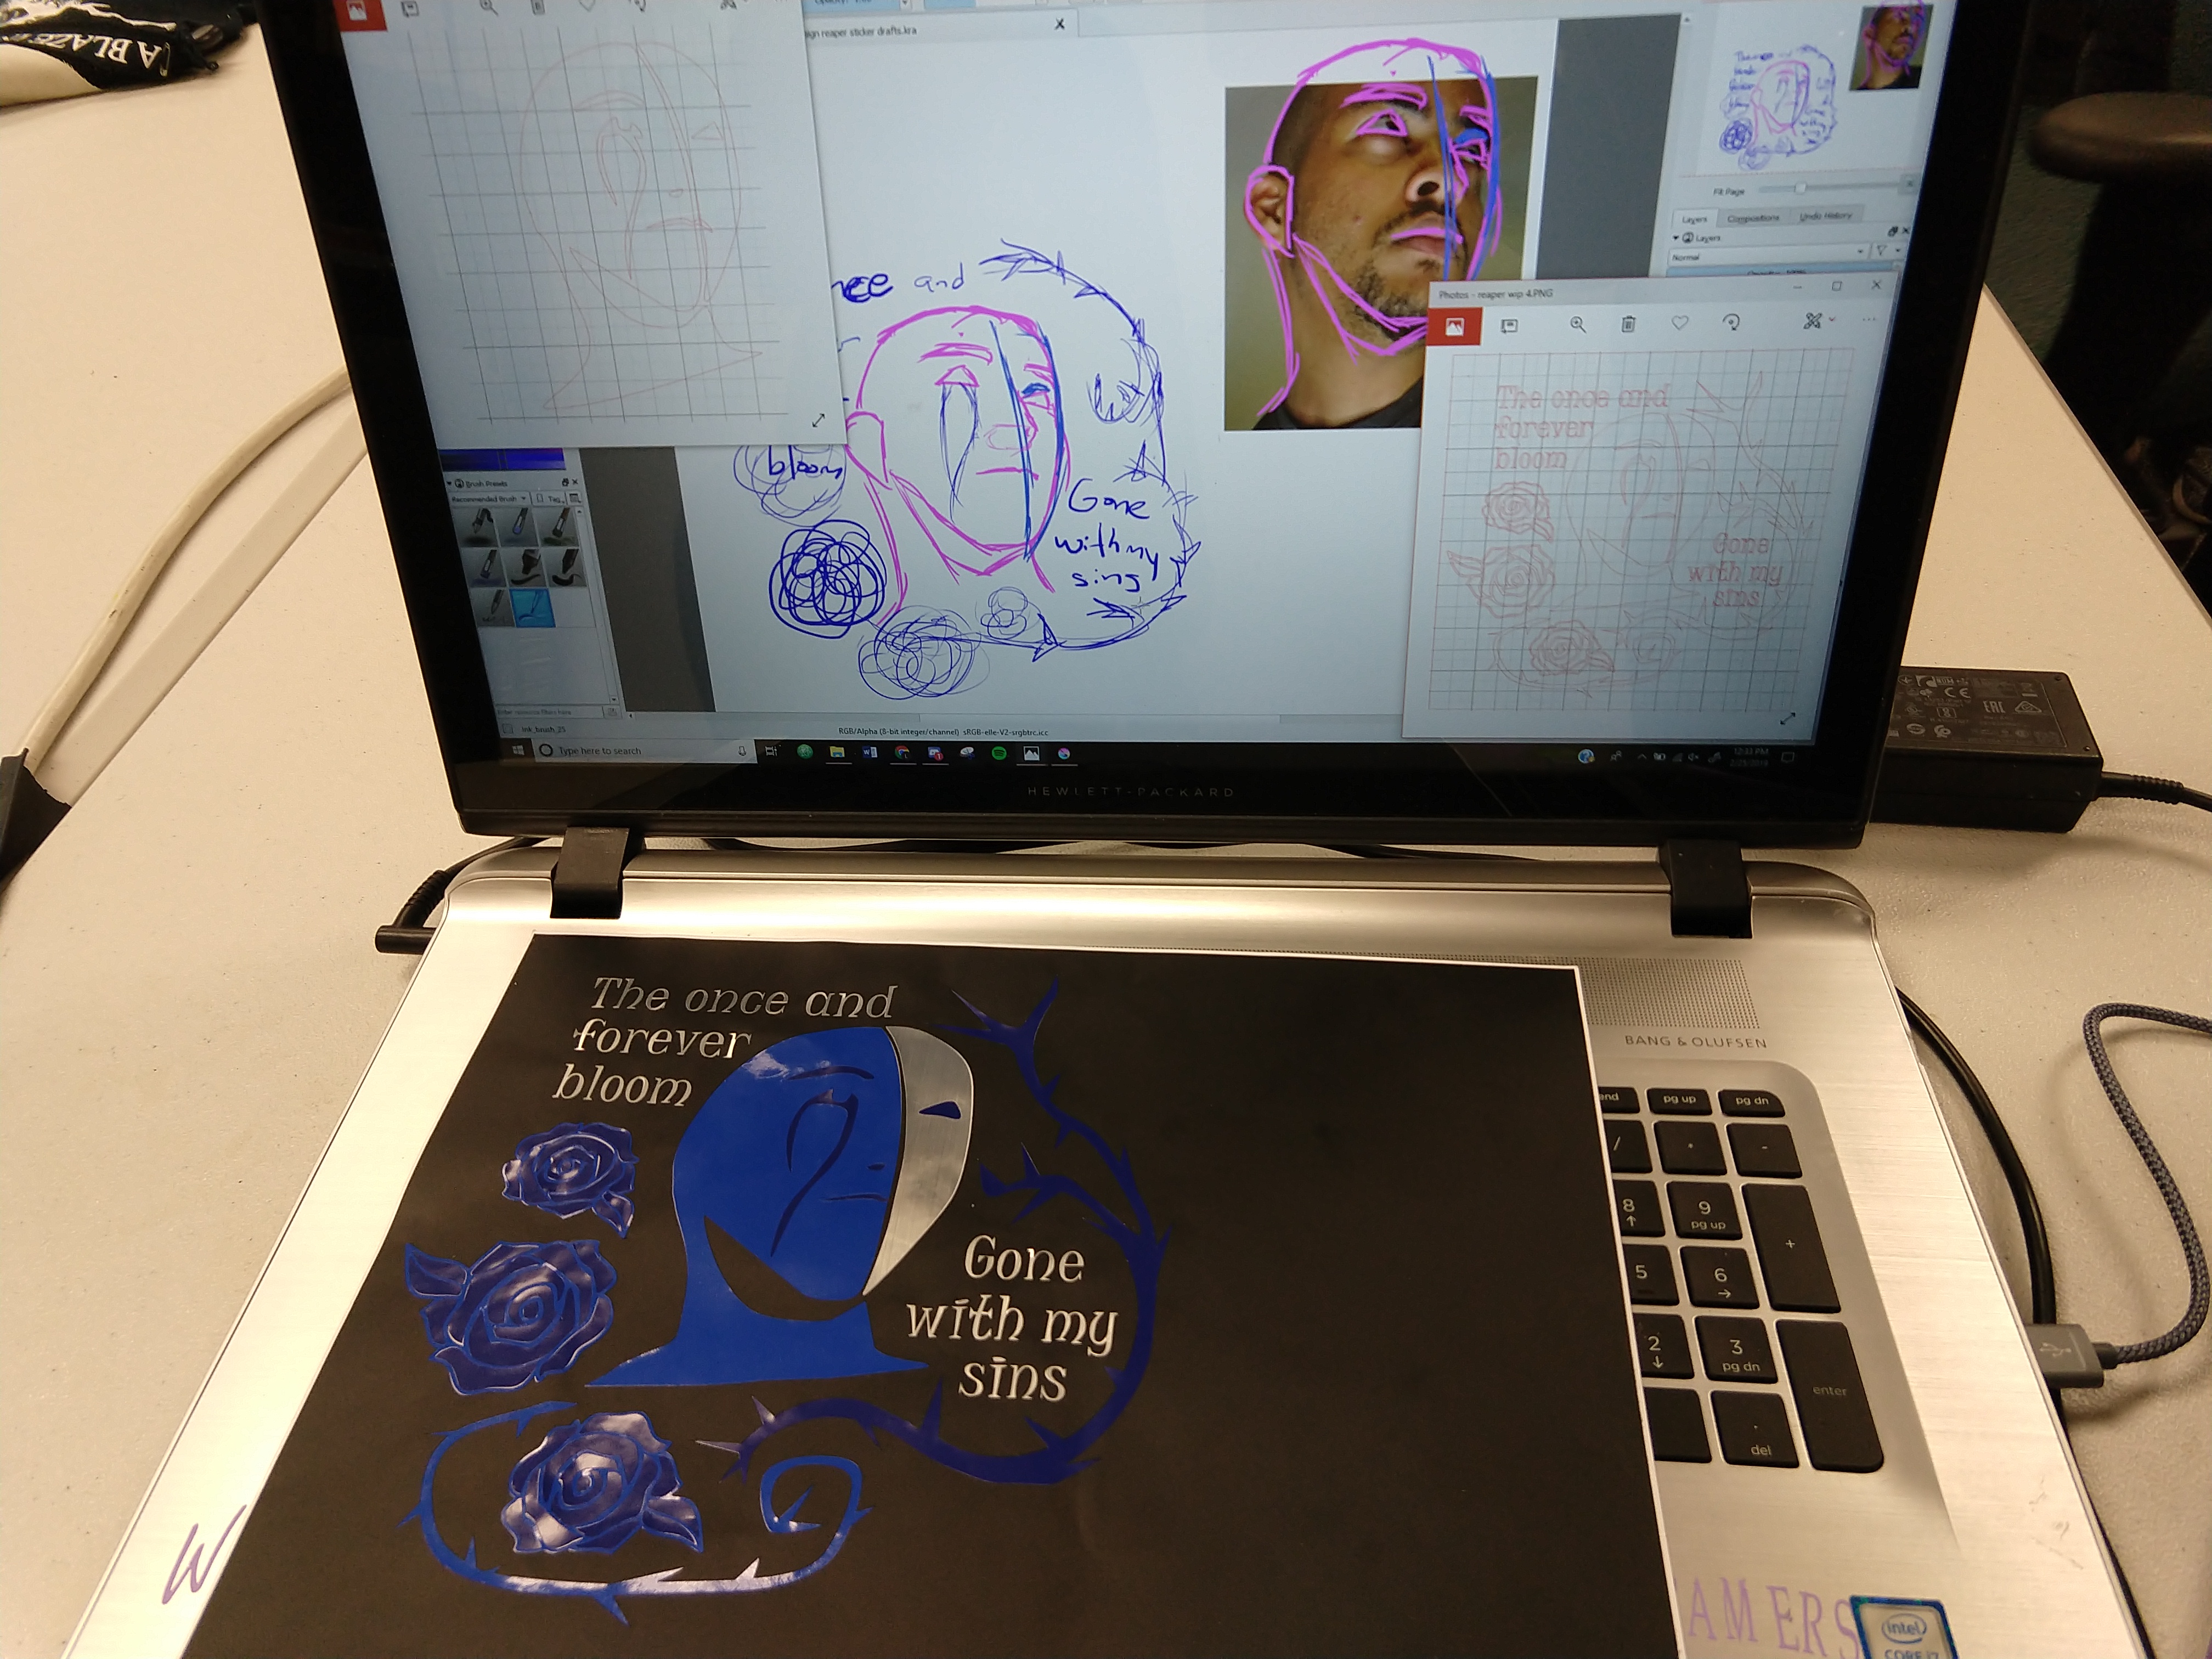
I developed a scalable visual identity beginning with a vector-based logo that incorporated the diverse materials used in the lab. The imagery embraced the playful nature of crafting spaces and materials, while also introducing affordable digital design technologies. Multiple logo variations were created by adding full-color photographs of successful student projects behind the text, effectively showcasing the program’s outcomes in its own branding.
These assets were leveraged to produce various marketing materials for outreach and advertising, including website banners, t-shirts, stickers, and stencils. The range of marketing materials helped me secure donations and external funding to keep the initiative operational for seven years (e.g., Maker Camp affiliate status and materials donation from Make Magazine and Google; Tufts University Novel Engineering grant; Texas State University Research Enhancement Program grant).
4. The Digital Repository: The MAKE Lab Website
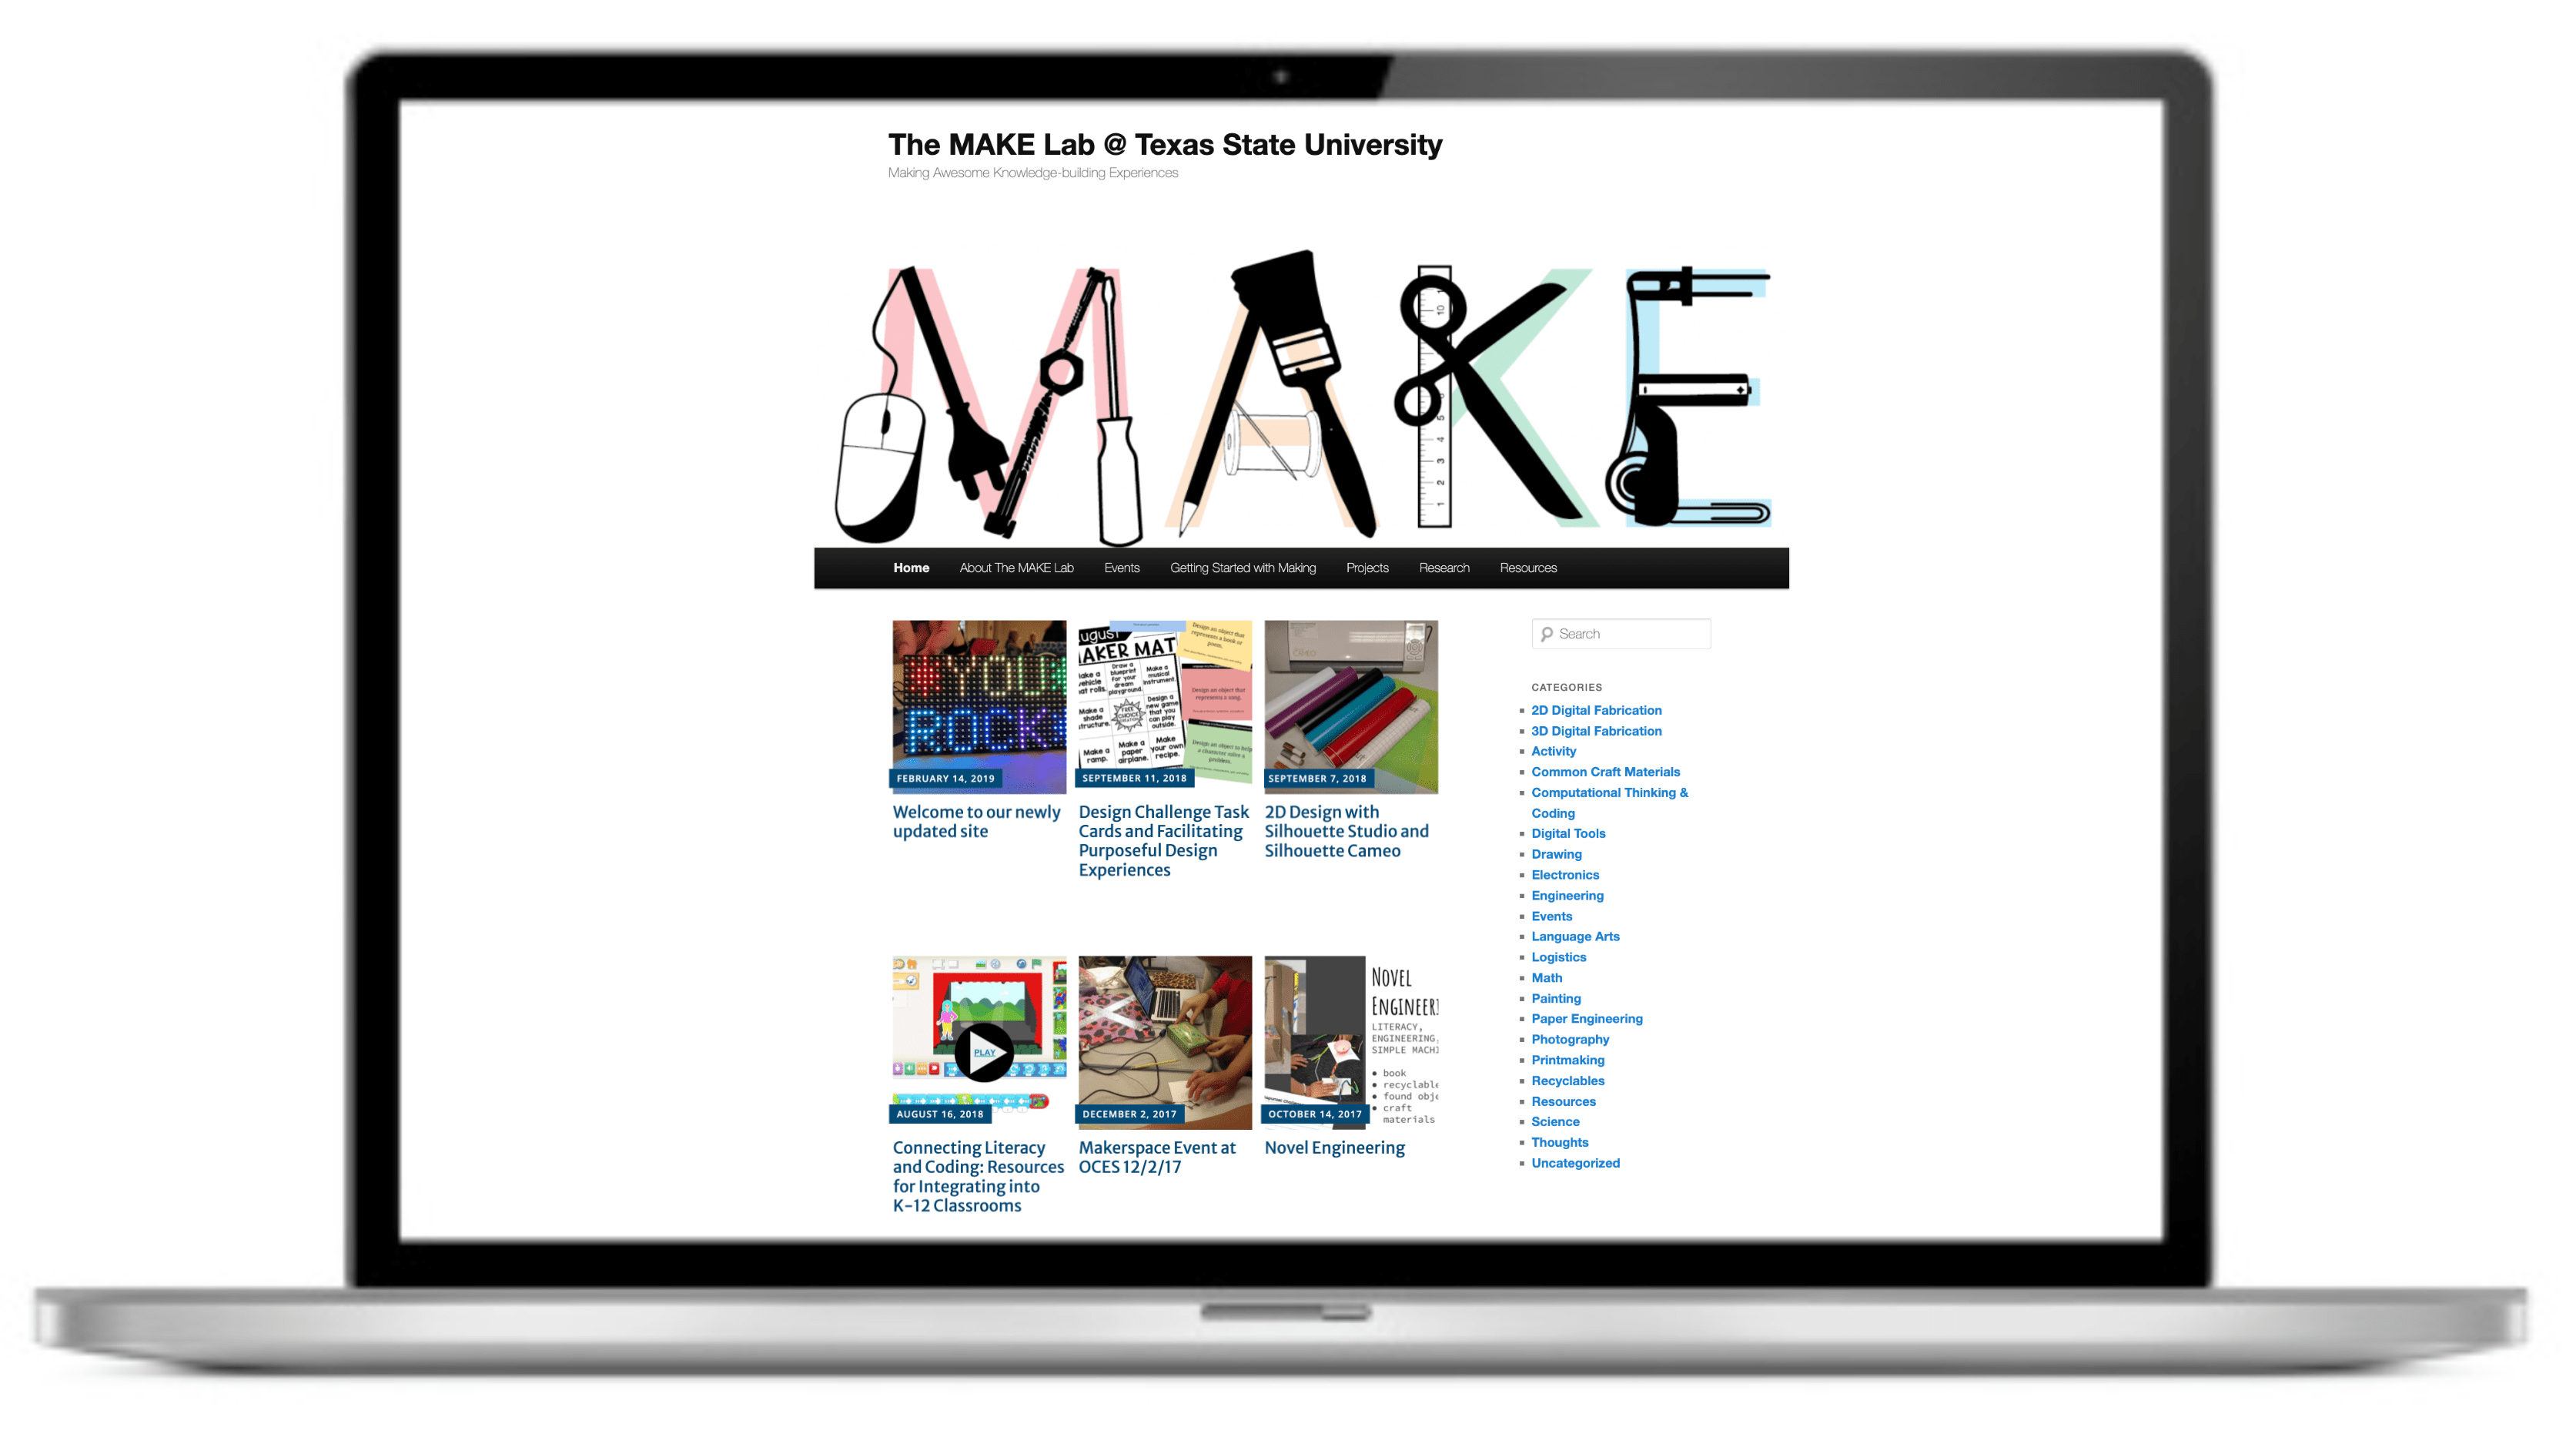
To scale the pedagogical impact beyond Central Texas, I developed and managed the MAKE Lab website, evolving it into a valuable, open-source resource.
- Evolution: The site initially served as a monthly blog, publishing the university students’ required post-event reflections and insights (the final step of their PAR cycle).
- Curation: The site quickly matured into a curated, online repository of peer-reviewed, teacher-created resources for facilitating makerspace activities in diverse content area contexts. This provided a permanent, accessible library for educators globally.
5. Impact and Results
Over seven years, the comprehensive program achieved significant, measurable results in both student mentorship and community outreach:
| METRIC | RESULT |
| Funding Raised | $75,000 in grants and donations |
| Students Mentored | 79 pre-service university students |
| Service Hours Delivered | 2,480 total hours of community service |
| Community Members Reached | 1,405 local community members served |
| Geographic Reach | In-person workshops in 6 cities across Central Texas and online website outreach across 8 countries |
| Visibility | Featured in 4 local newspapers and 4 journals |
The MAKE Lab successfully served as a high-impact mentorship model, empowering future educators while extending critical learning resources to communities that needed them most.
Featured publications:
Smith, S. (2017). Mobile makerspace carts: a practical model to transcend access and space. In M. Mills, & D. Wake (Eds.), Empowering learners with mobile open-access learning initiatives (pp. 58-73). Hershey, PA: IGI Global. Available at: https://eric.ed.gov/?id=ED574989
Smith, S. (2017). Student-Created reflective video as meaningful formative and summative assessment during hands-on learning experiences. In P. Resta & S. Smith (Eds.), Proceedings of Society for Information Technology & Teacher Education International Conference 2017 (pp. 1191-1198). Chesapeake, VA: Association for the Advancement of Computing in Education (AACE). Available at: https://www.learntechlib.org/primary/p/177896
Smith, S. (2018). Making visual connections: Children’s negotiations of visualization skills during a design-based learning experience with non-digital techniques and digital fabrication technologies. Interdisciplinary Journal of Problem-Based Learning. 12(2), Article 4. Available at: https://doi.org/10.7771/1541-5015.1747
Smith, S. (2014). 3D printing: Where art & technology collide. Trends in Art Education. 57(1), 16-23. Available at: https://www.taea.org/TAEA/Docs/2014/TRENDS-2014.pdf
Approachable course design for digital fabrication and simple electronics
Project Overview
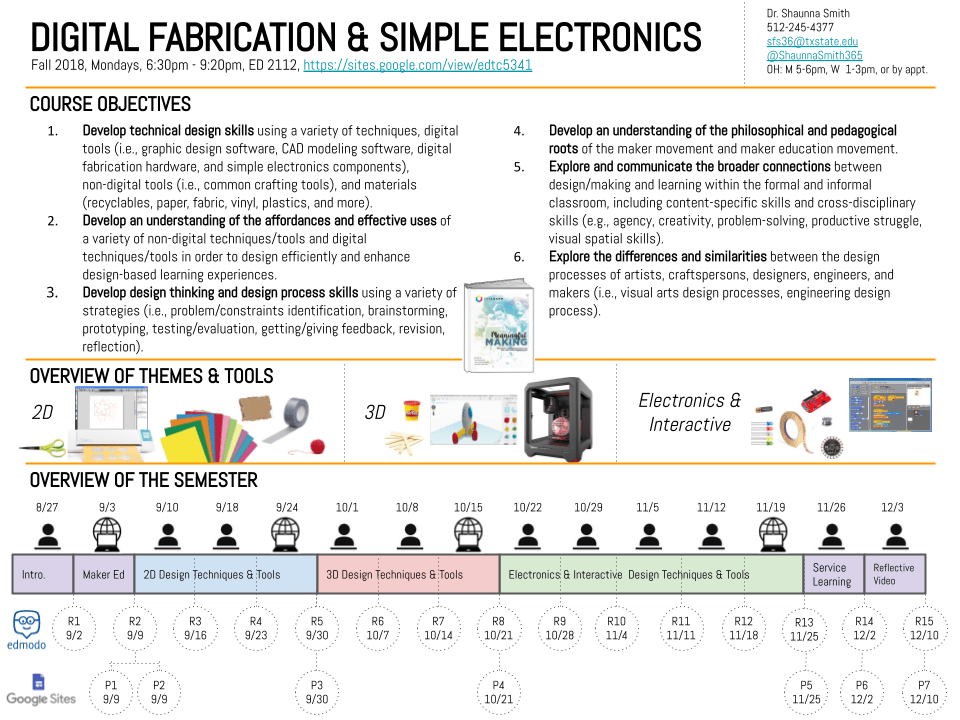
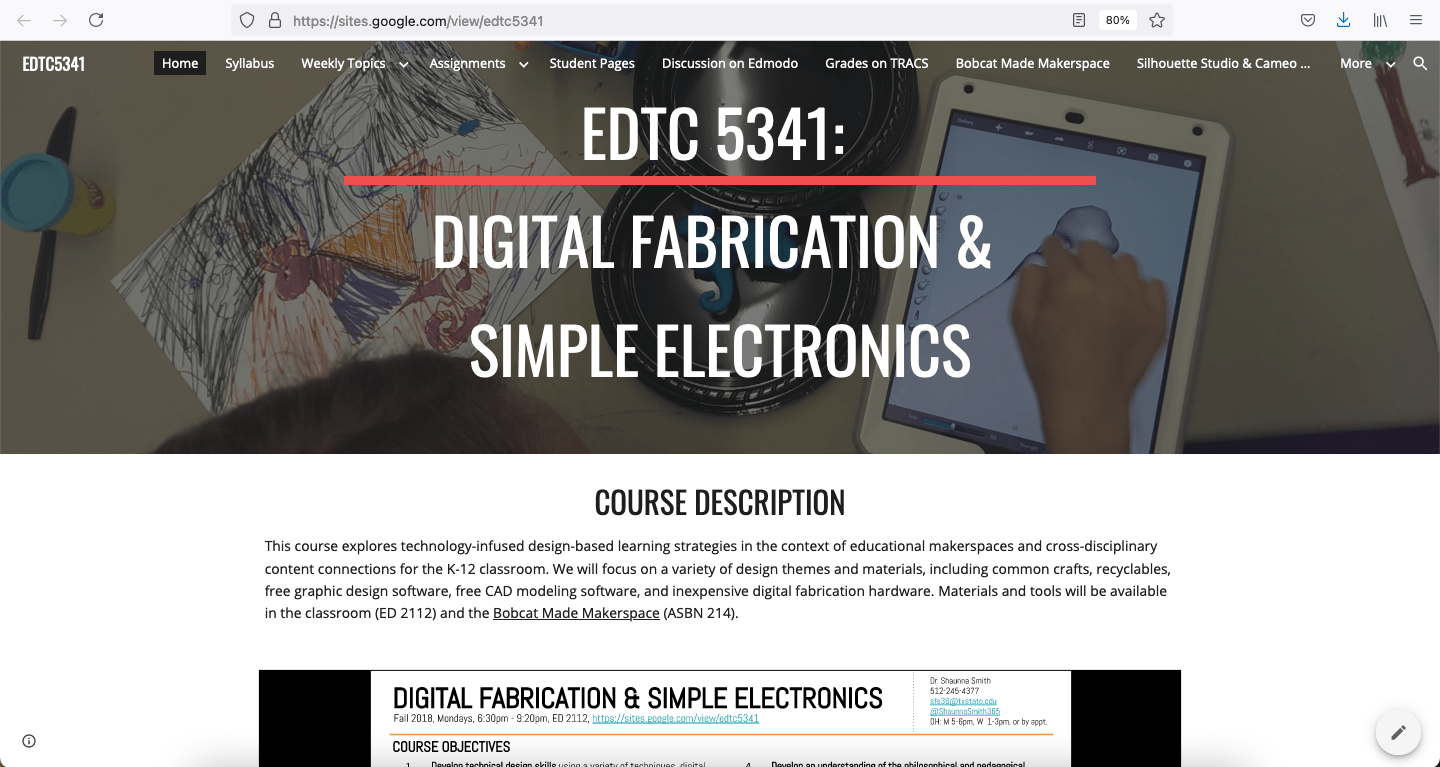
Teachers are often intimidated by new technologies and uncertain how to learn to integrate them into their classrooms or acquire necessary materials. This is especially true for digital fabrication and simple electronics, which are engineering technology topics that few teachers were exposed to during their initial training. I designed this course for graduate-level Educational Technology M.Ed. students, which explored technology-infused design-based learning strategies in the context of educational makerspaces and cross-disciplinary content connections for the K-12 classroom. To make the course approachable, the focus was on maker mindsets and utilized a variety of accessible design themes (i.e., 2D, 3D, electronics and interactive) and materials (i.e., common crafts, recyclables, textiles, free graphic design software, free CAD modeling software, inexpensive digital fabrication hardware). A variation of this course was also developed as an honors course, which focused on interdisciplinary connections within art, craft, design, and engineering. Figure 1 shows the course syllabus outline and Figure 2 shows a screenshot of the course website, which I designed in Google Sites.
Curriculum
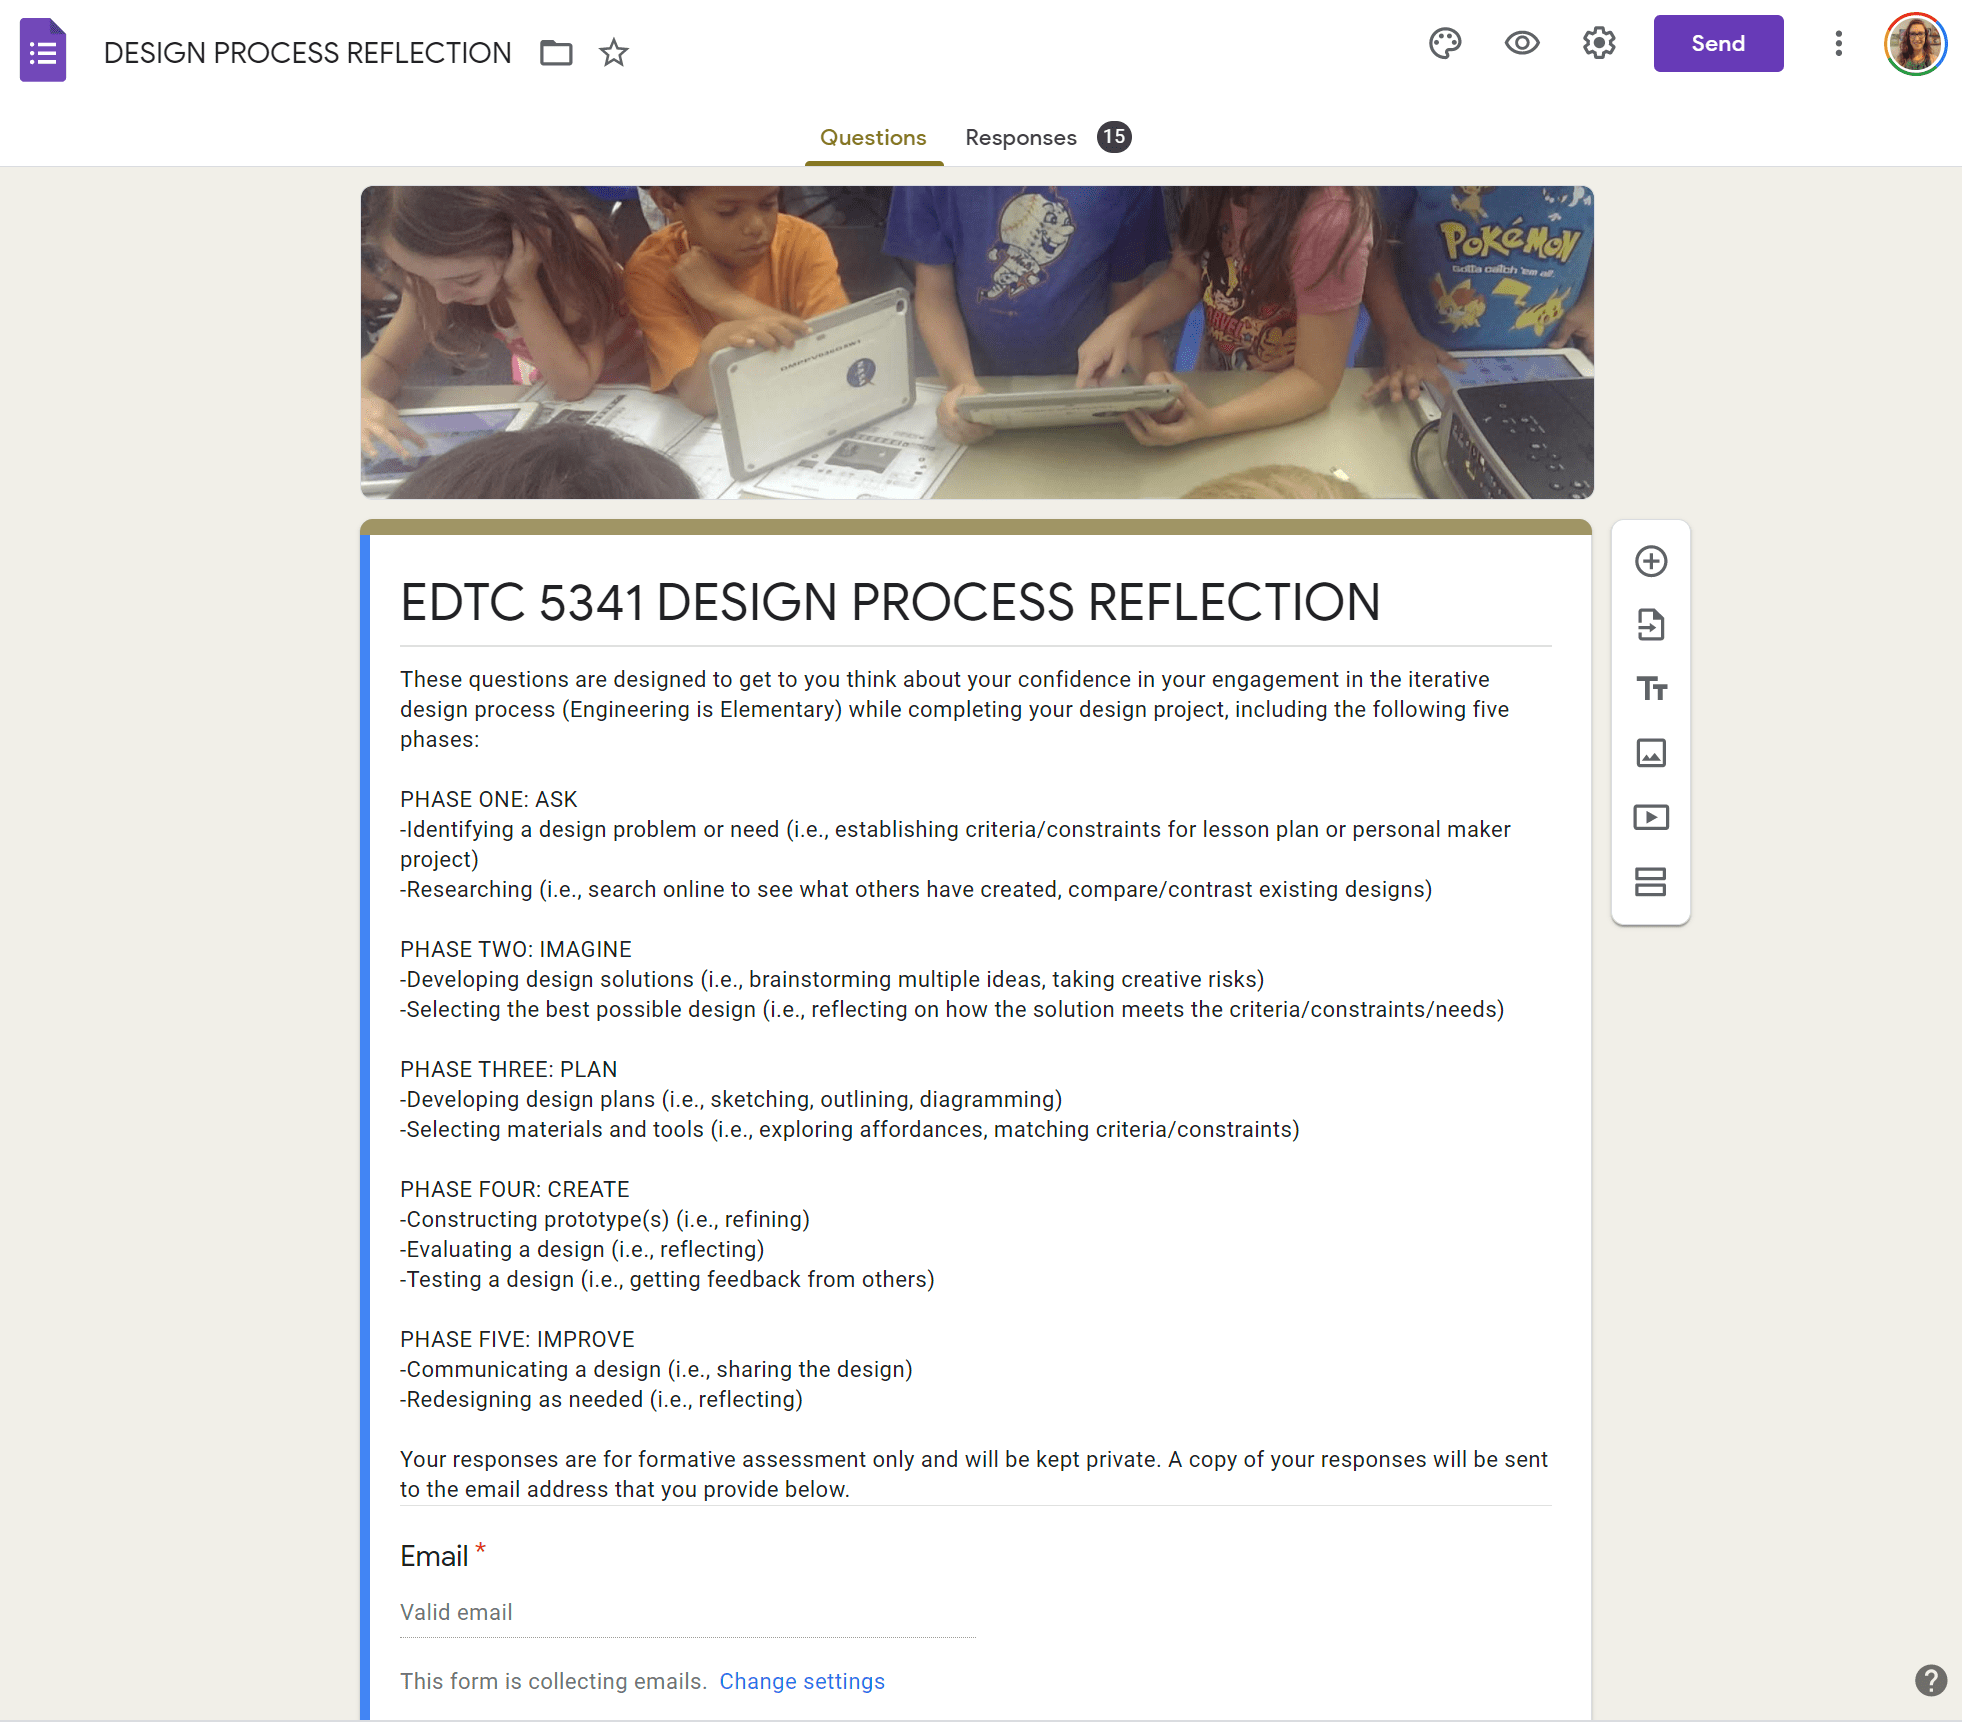
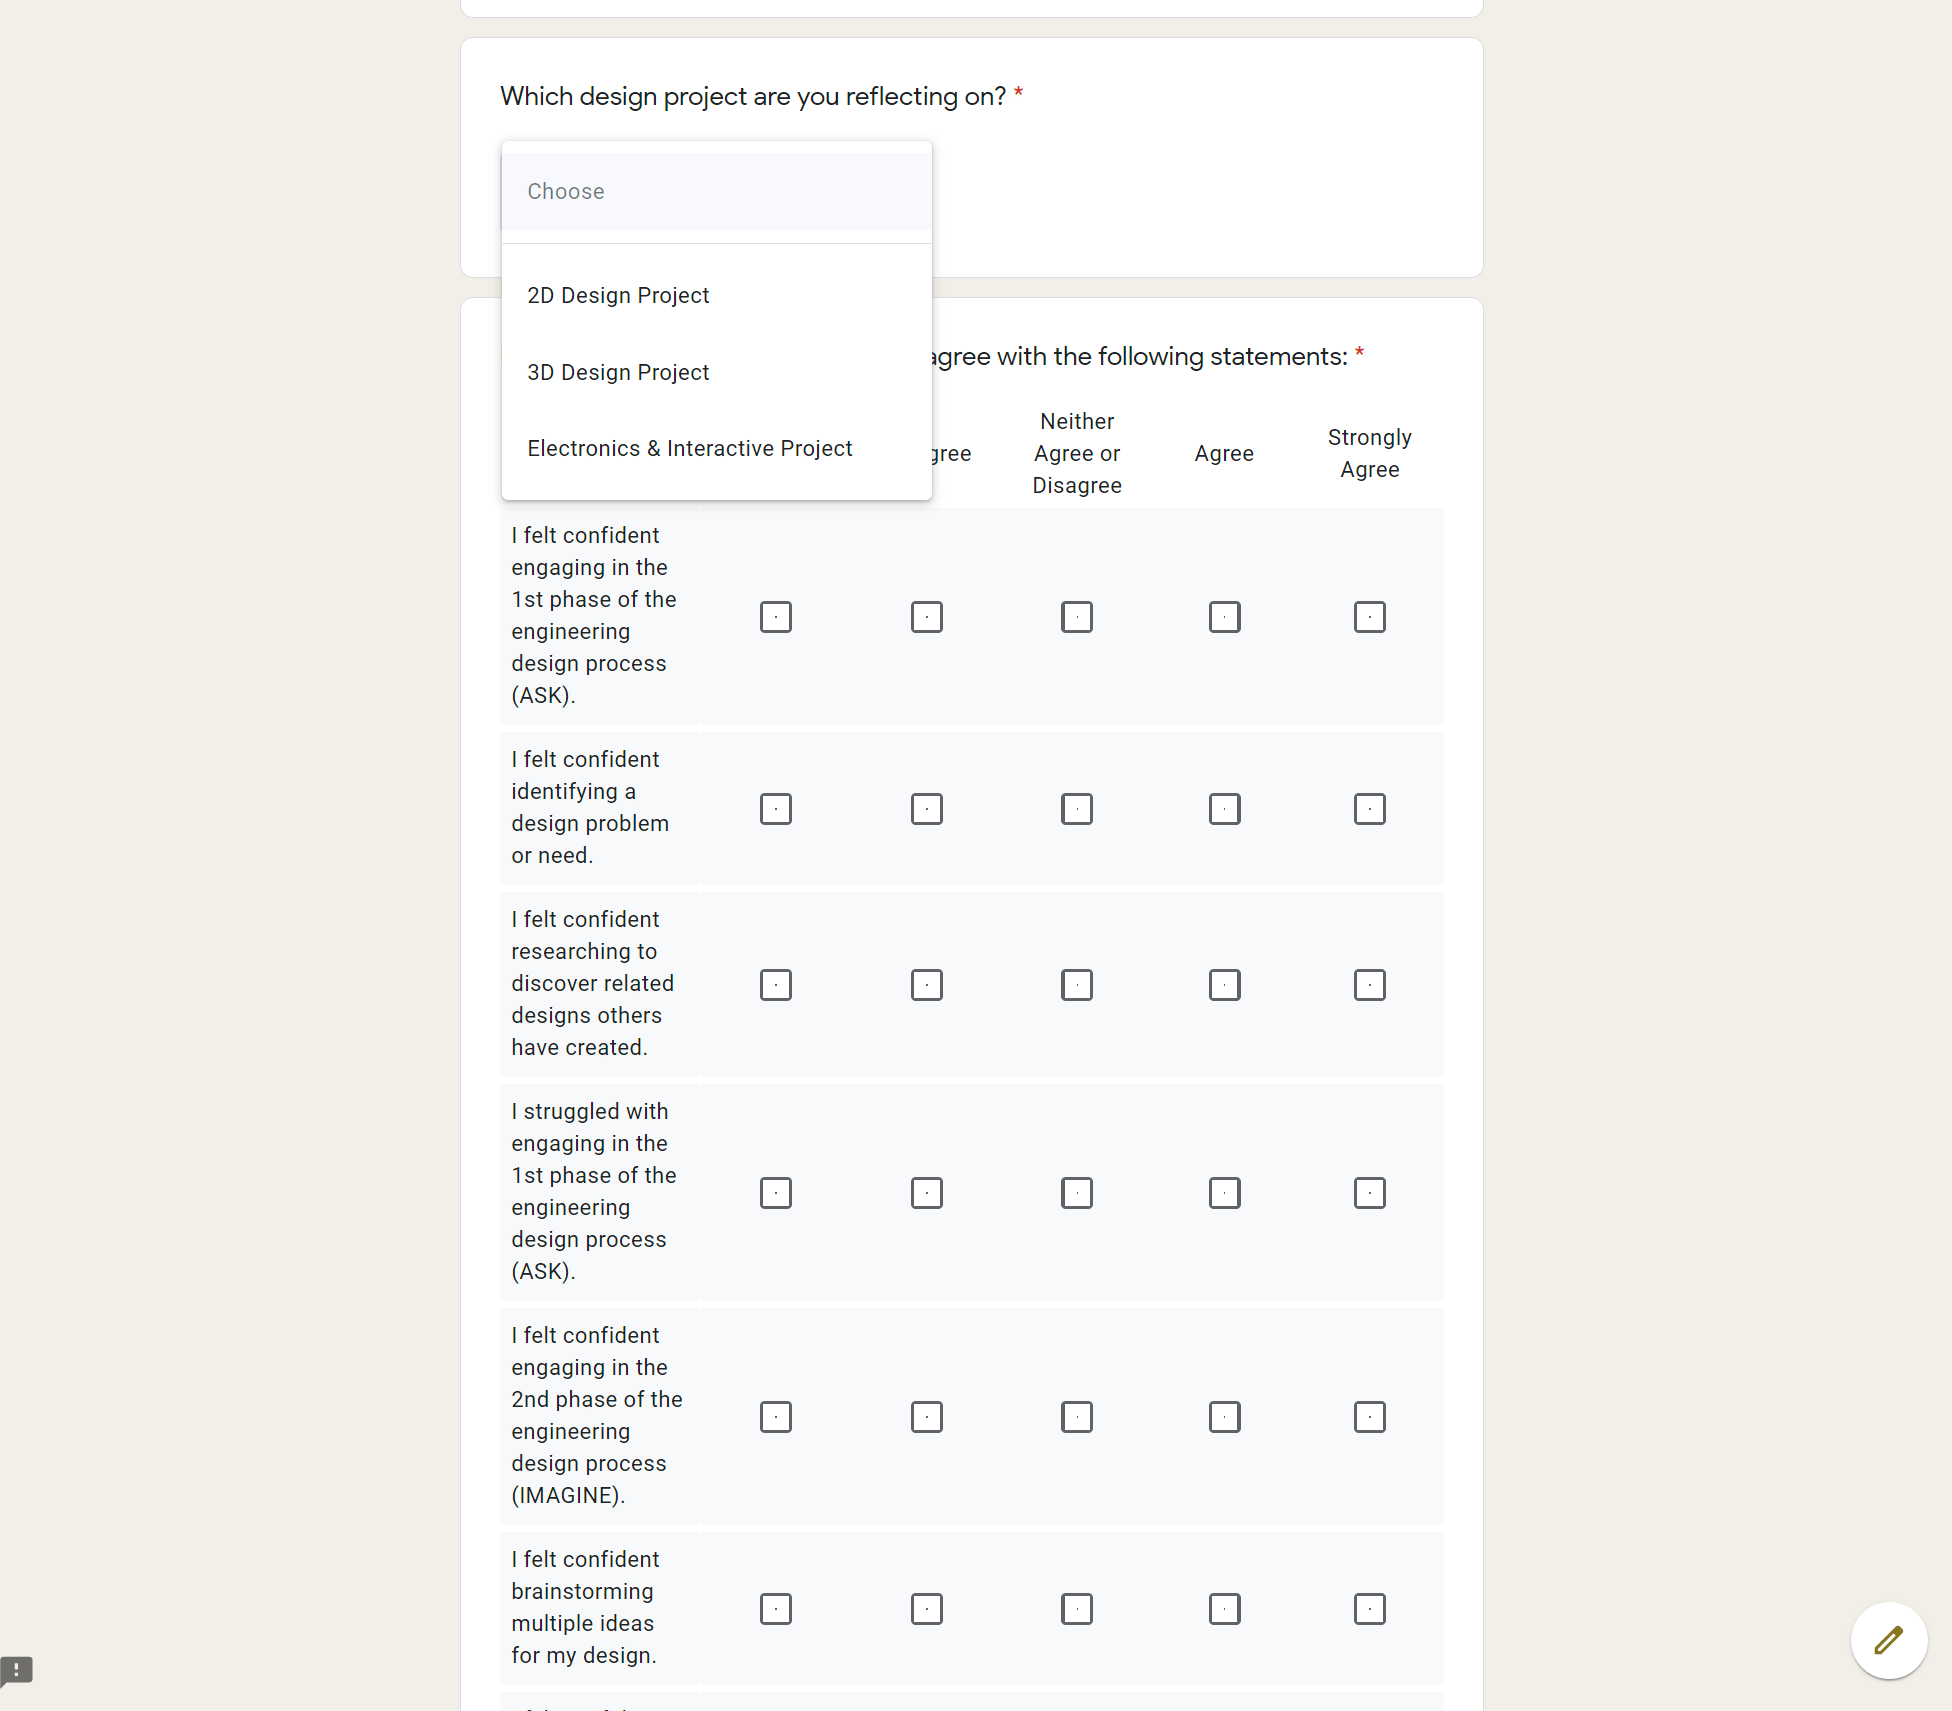
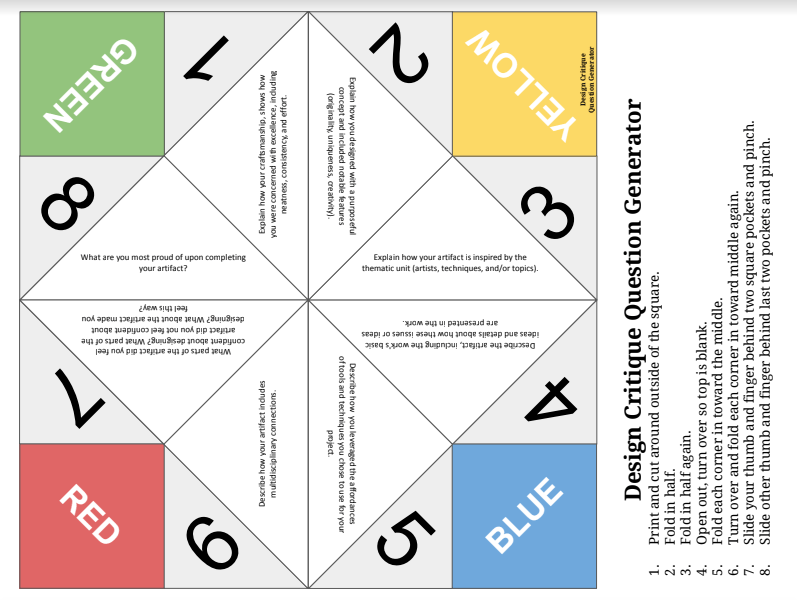
I drew inspiration from a variety of related resources, including the Exploratorium Tinkering Studio’s Learning Dimensions and AbD Thinking Routines. My scaffolded curriculum connected to ISTE standards for educators and included creative warm-ups (e.g., SCAMPER, 30 Circles, Exquisite Corpse Drawings), familiar craft materials and techniques that introduced more advanced digital techniques, interactive discussions of design process (e.g. design critique fortune teller), and differentiated assessments for formative and summative learning (e.g., graphic organizers, weekly reflections, project reflections). Weekly lessons used a 5E model, including engaging connections between art and STEM, guided practice, independent practice, and design critique. Each week students were tasked to complete a reflection that explored their engagement in the lesson, documentation of their design process, and areas of concern about concepts. Thematic units consisted of approximately 4 weekly lessons that explored various techniques and culminated with a design project where students could choose to engage in a project that expanded upon one or more of the techniques, which was graded by an analytic rubric and included an online project reflection form. Final projects included 1) transforming one of their design artifacts into an activity that they would facilitate at a local workshop and 2) creating a summative autoethnographic multimedia project that examined how their personal and professional creativity evolved throughout the course.
Below you can see curriculum examples including, lesson reflections, in-class resources, and other activity materials.
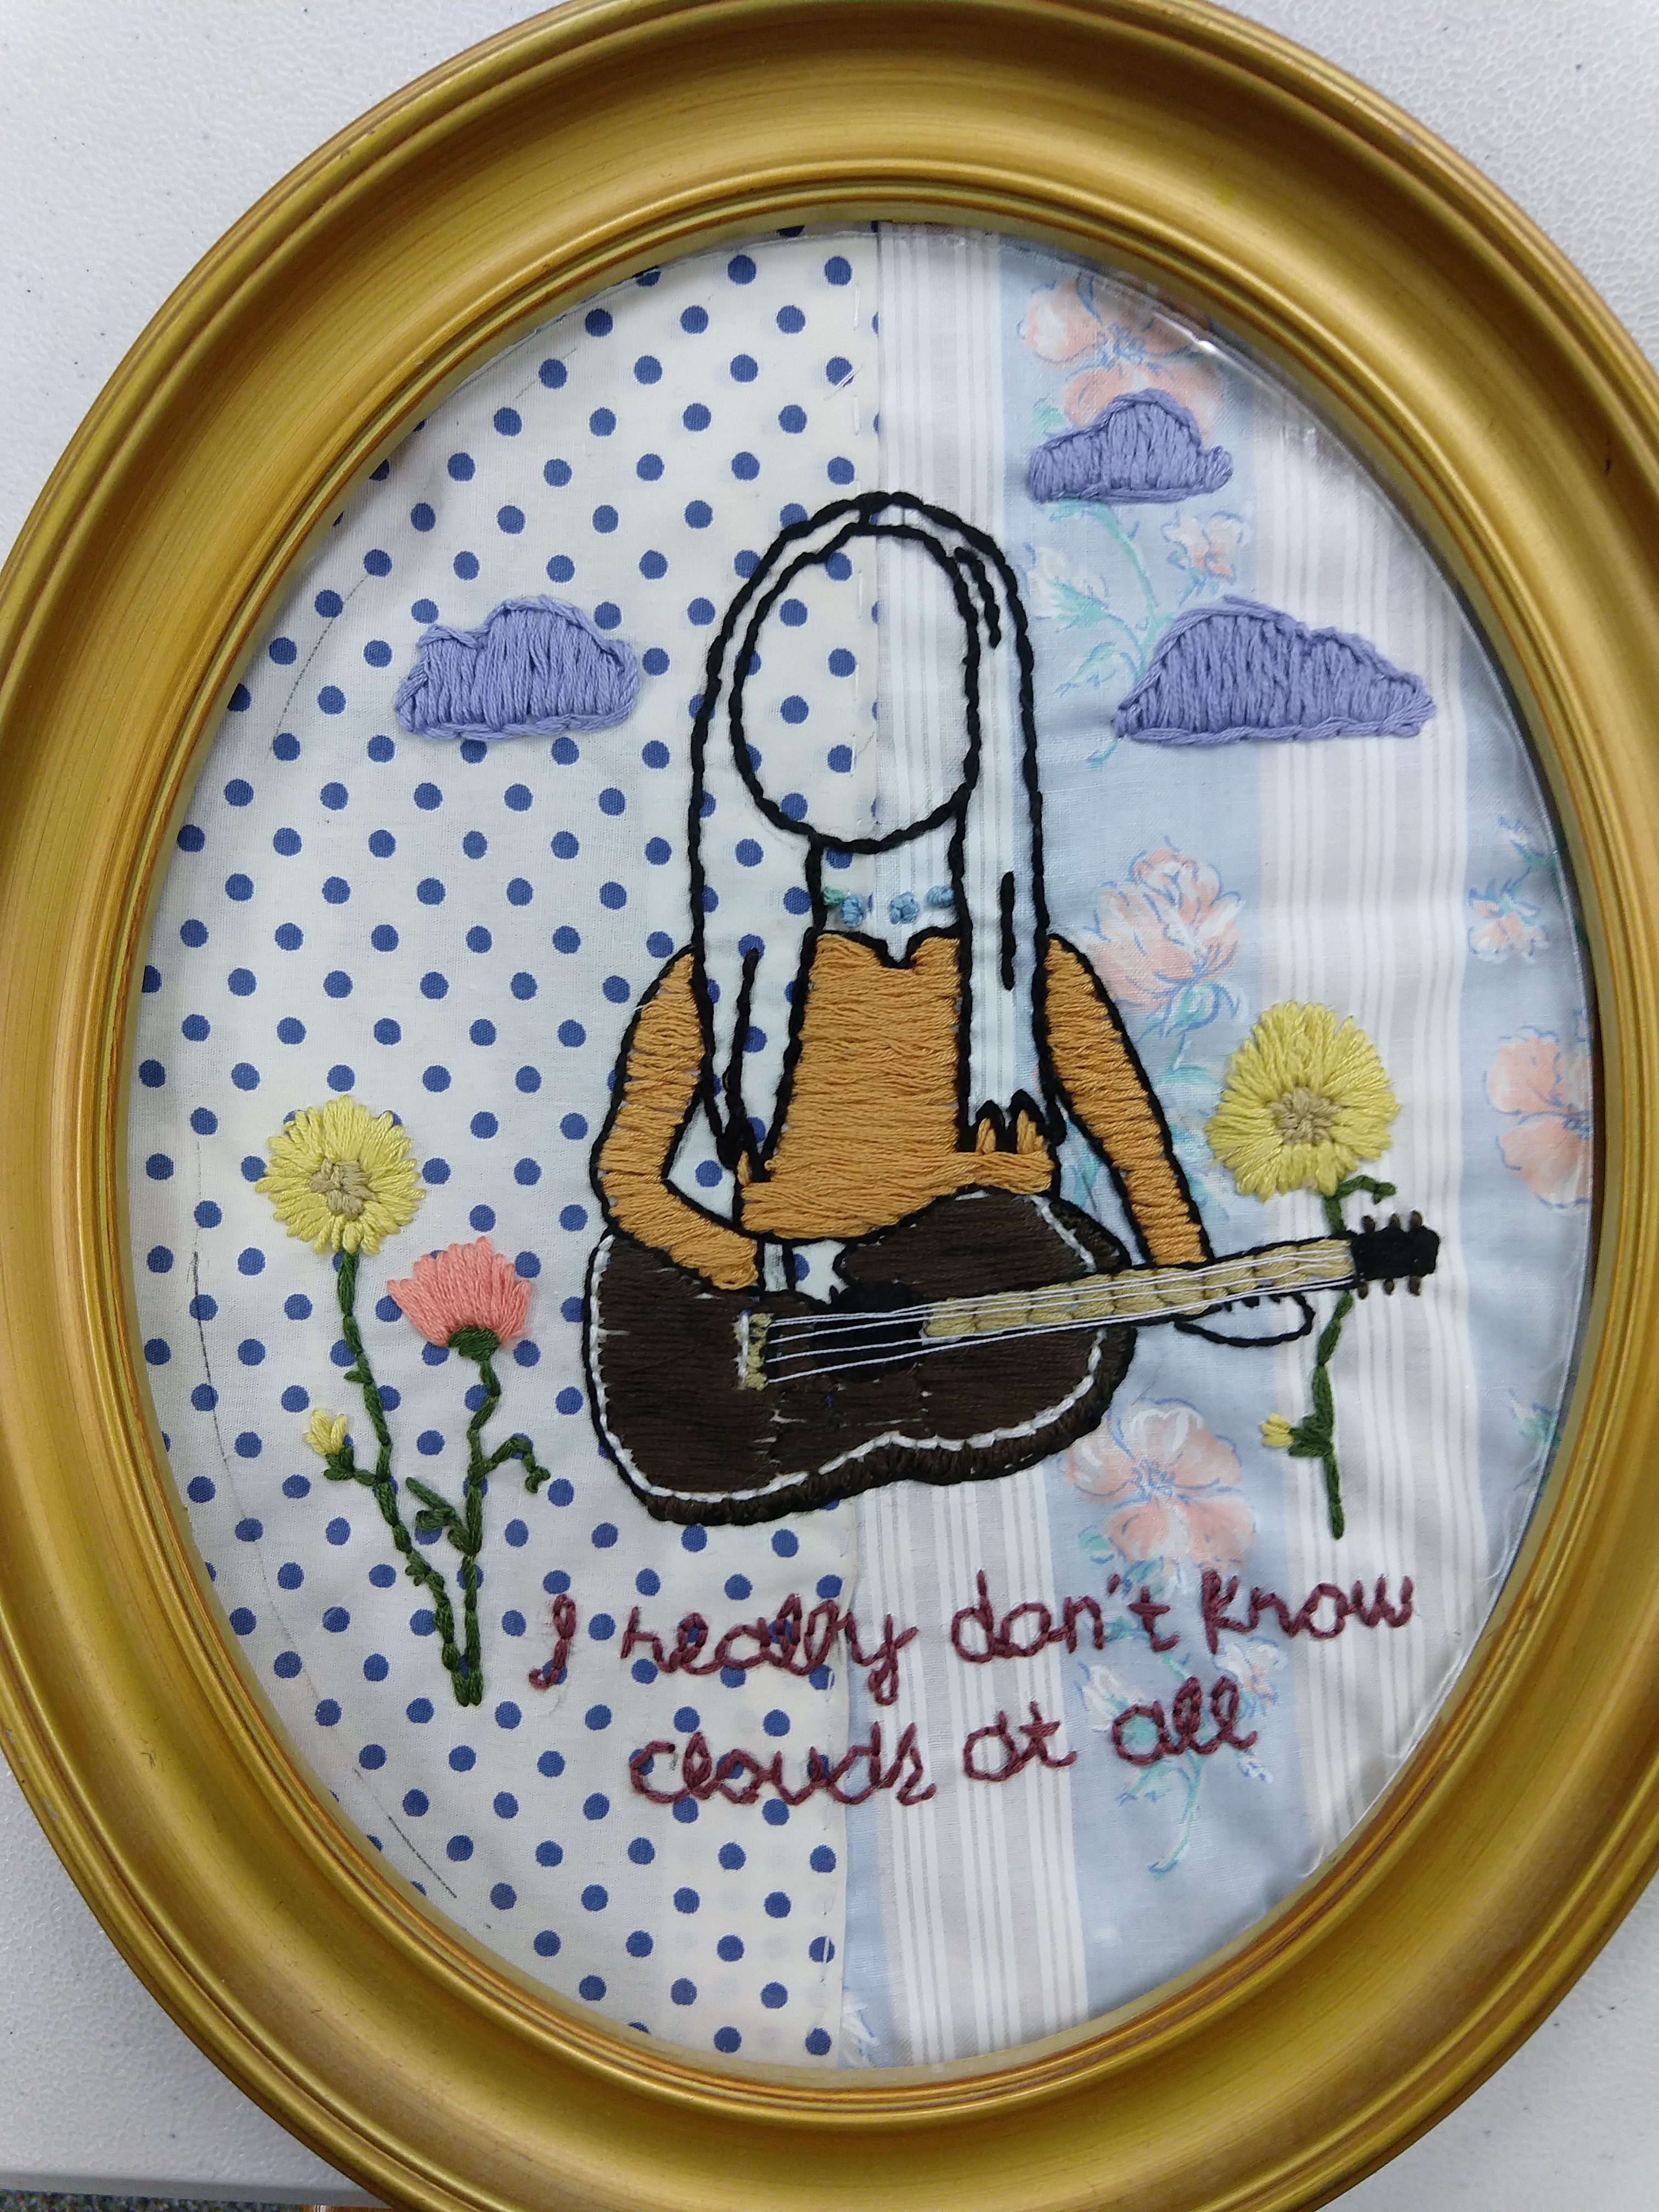
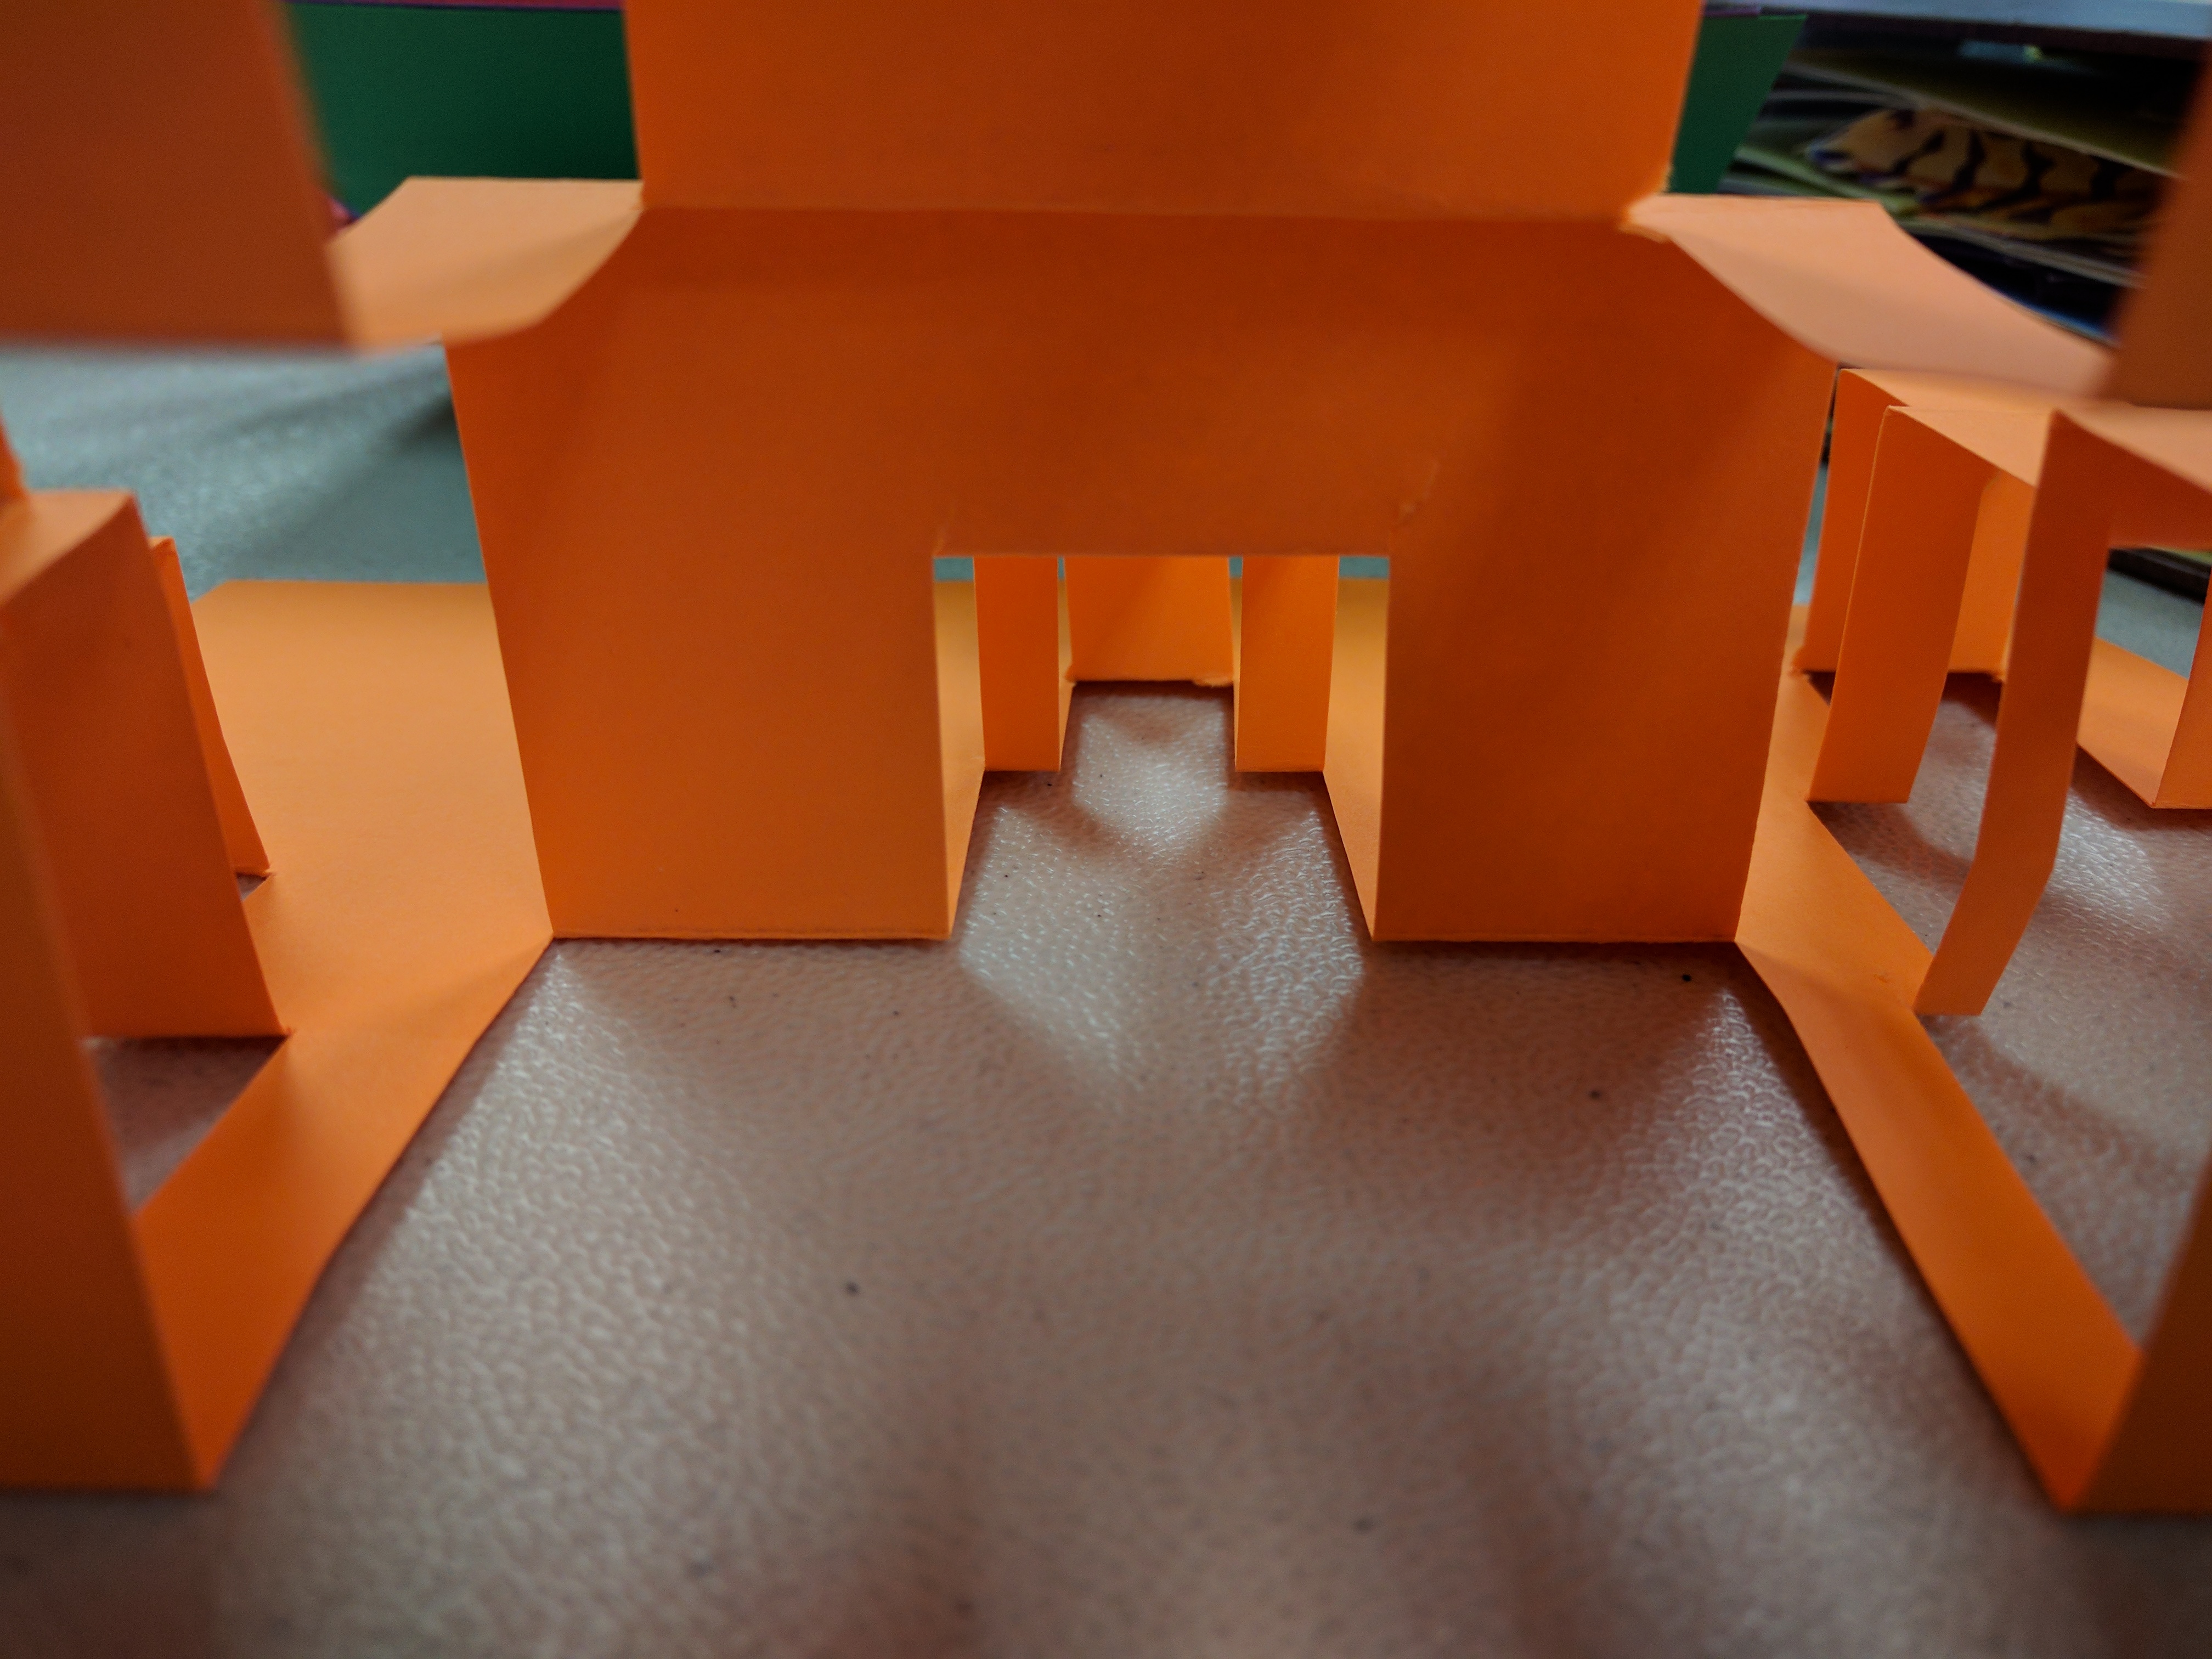
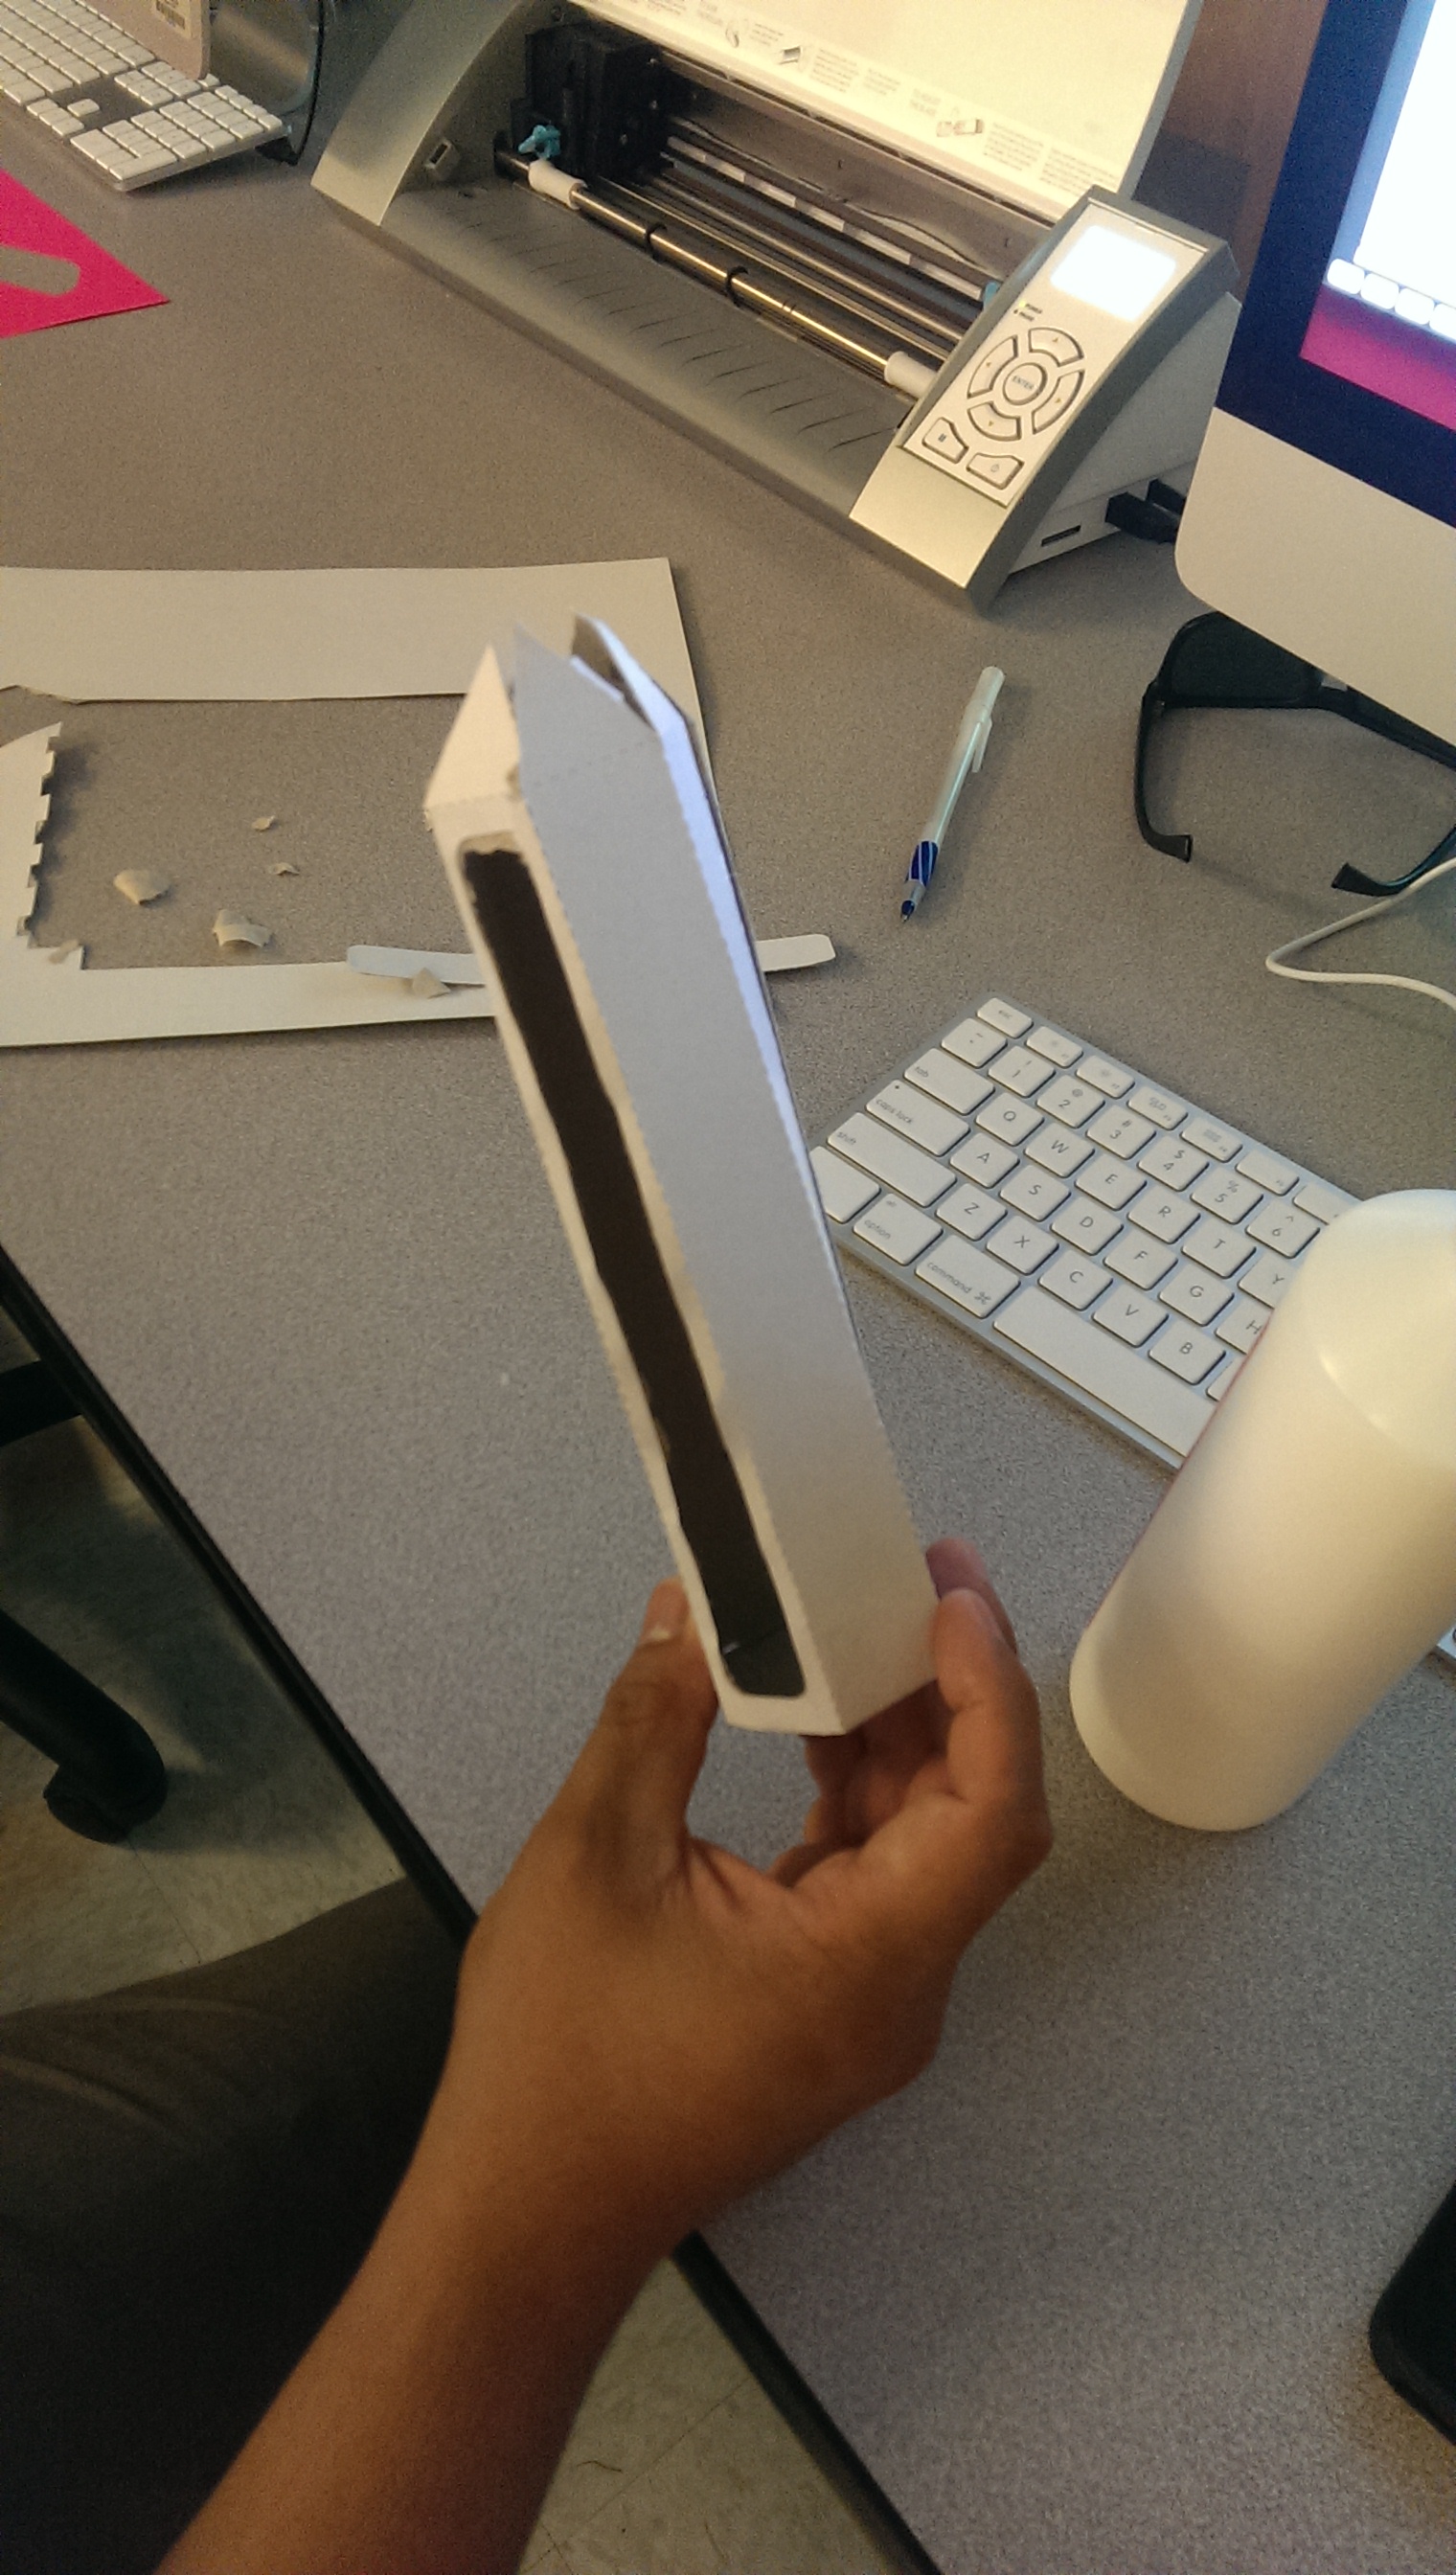
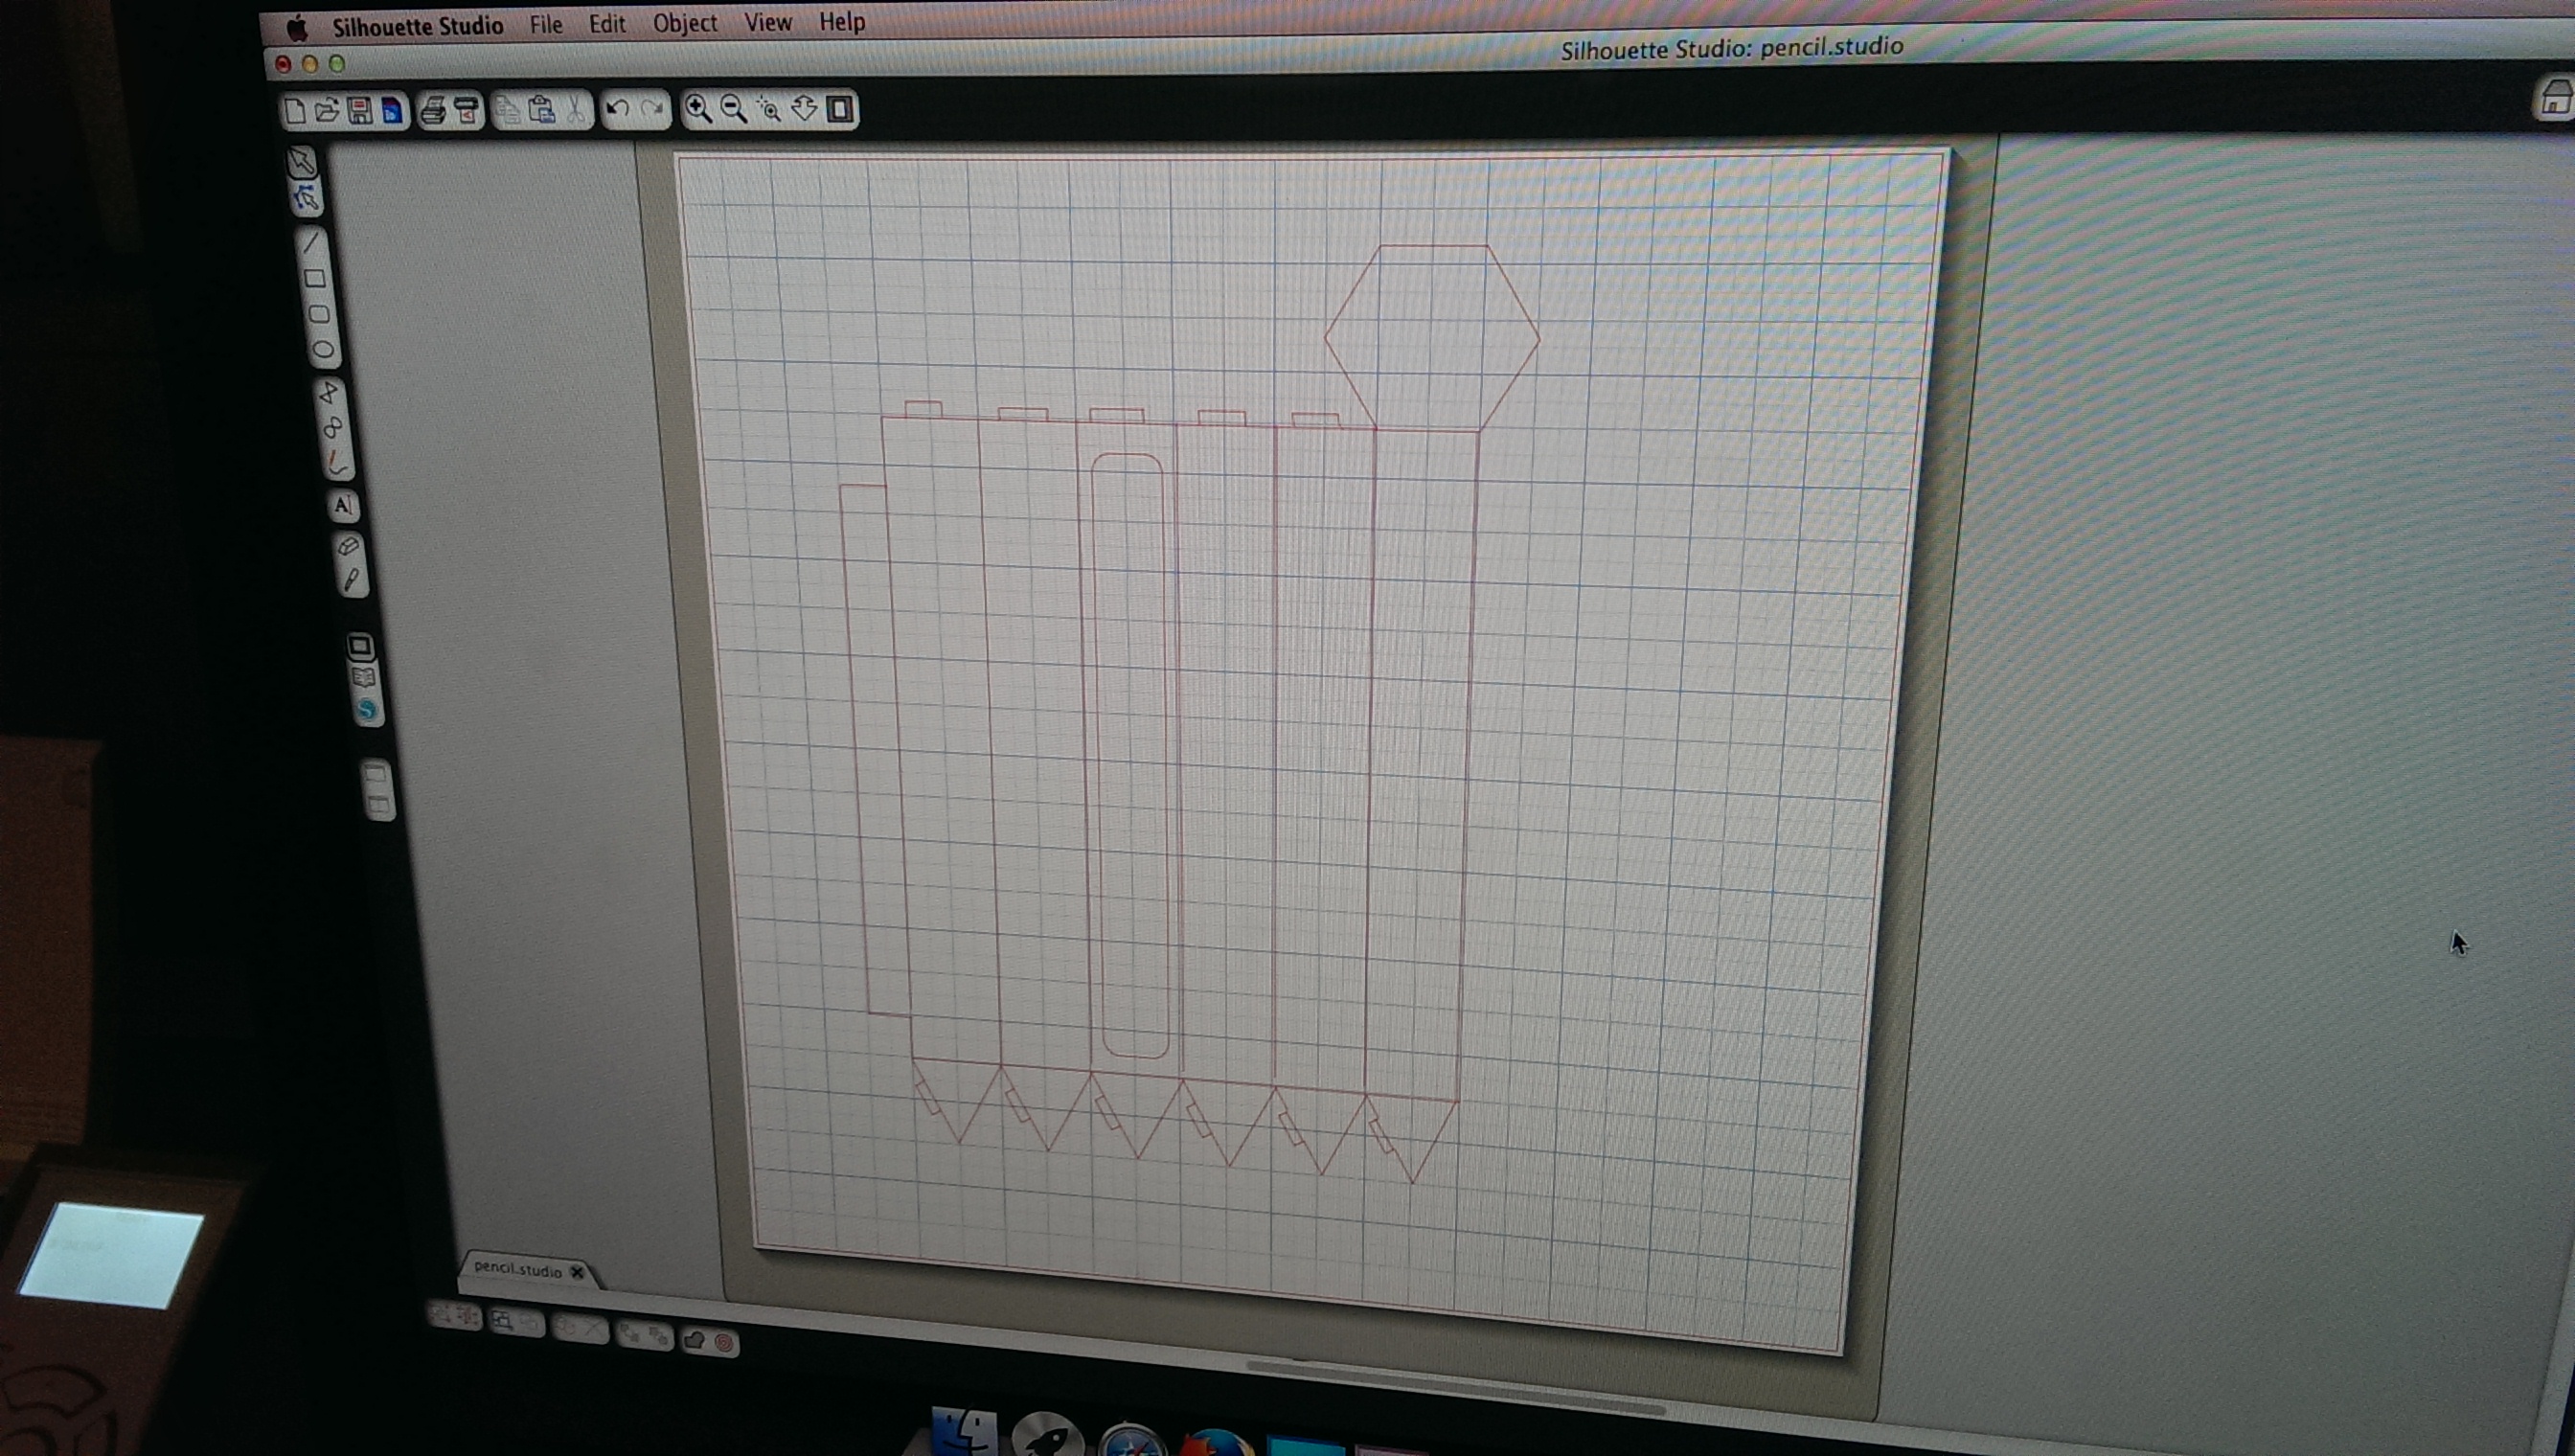
2D design unit
The 2D design unit included papercraft, paper/vinyl cutting software and hardware, textiles, and digital sewing and embroidery machines.

3D design unit
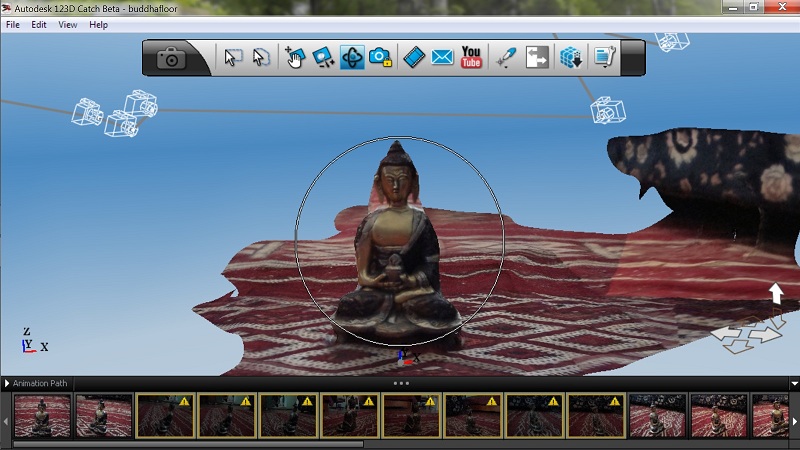
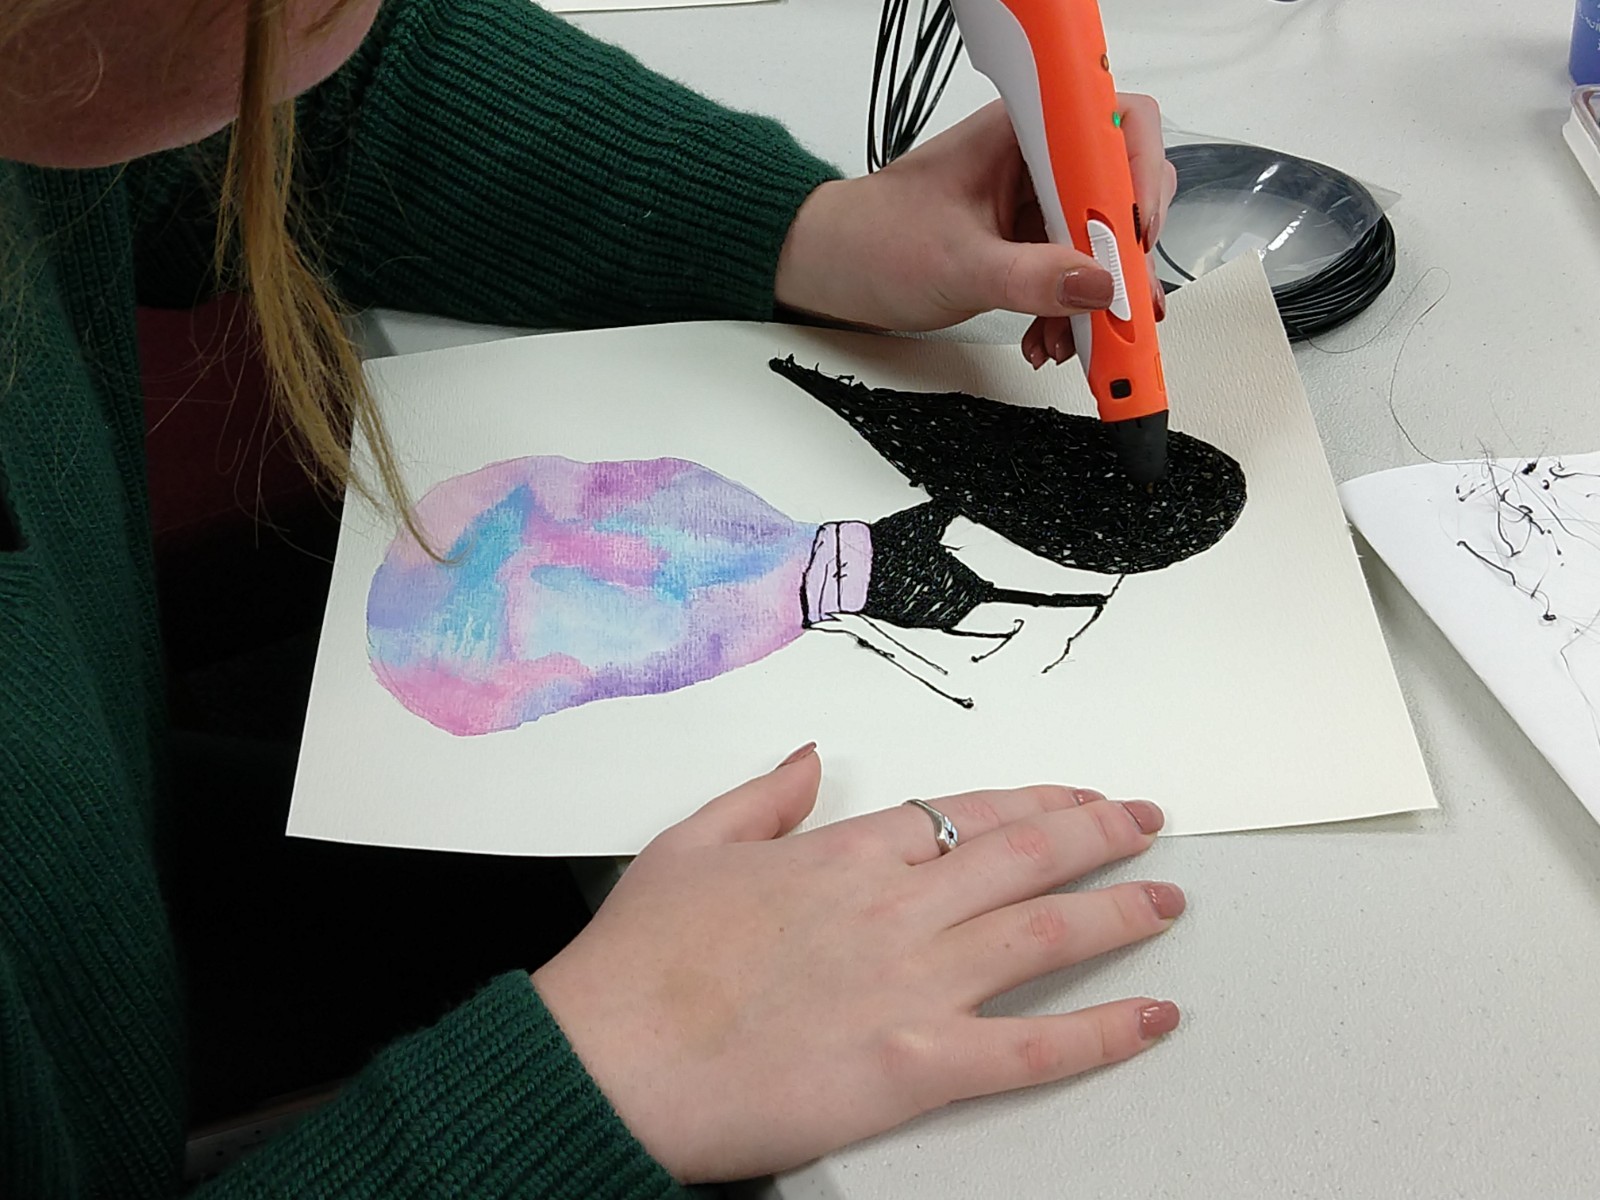
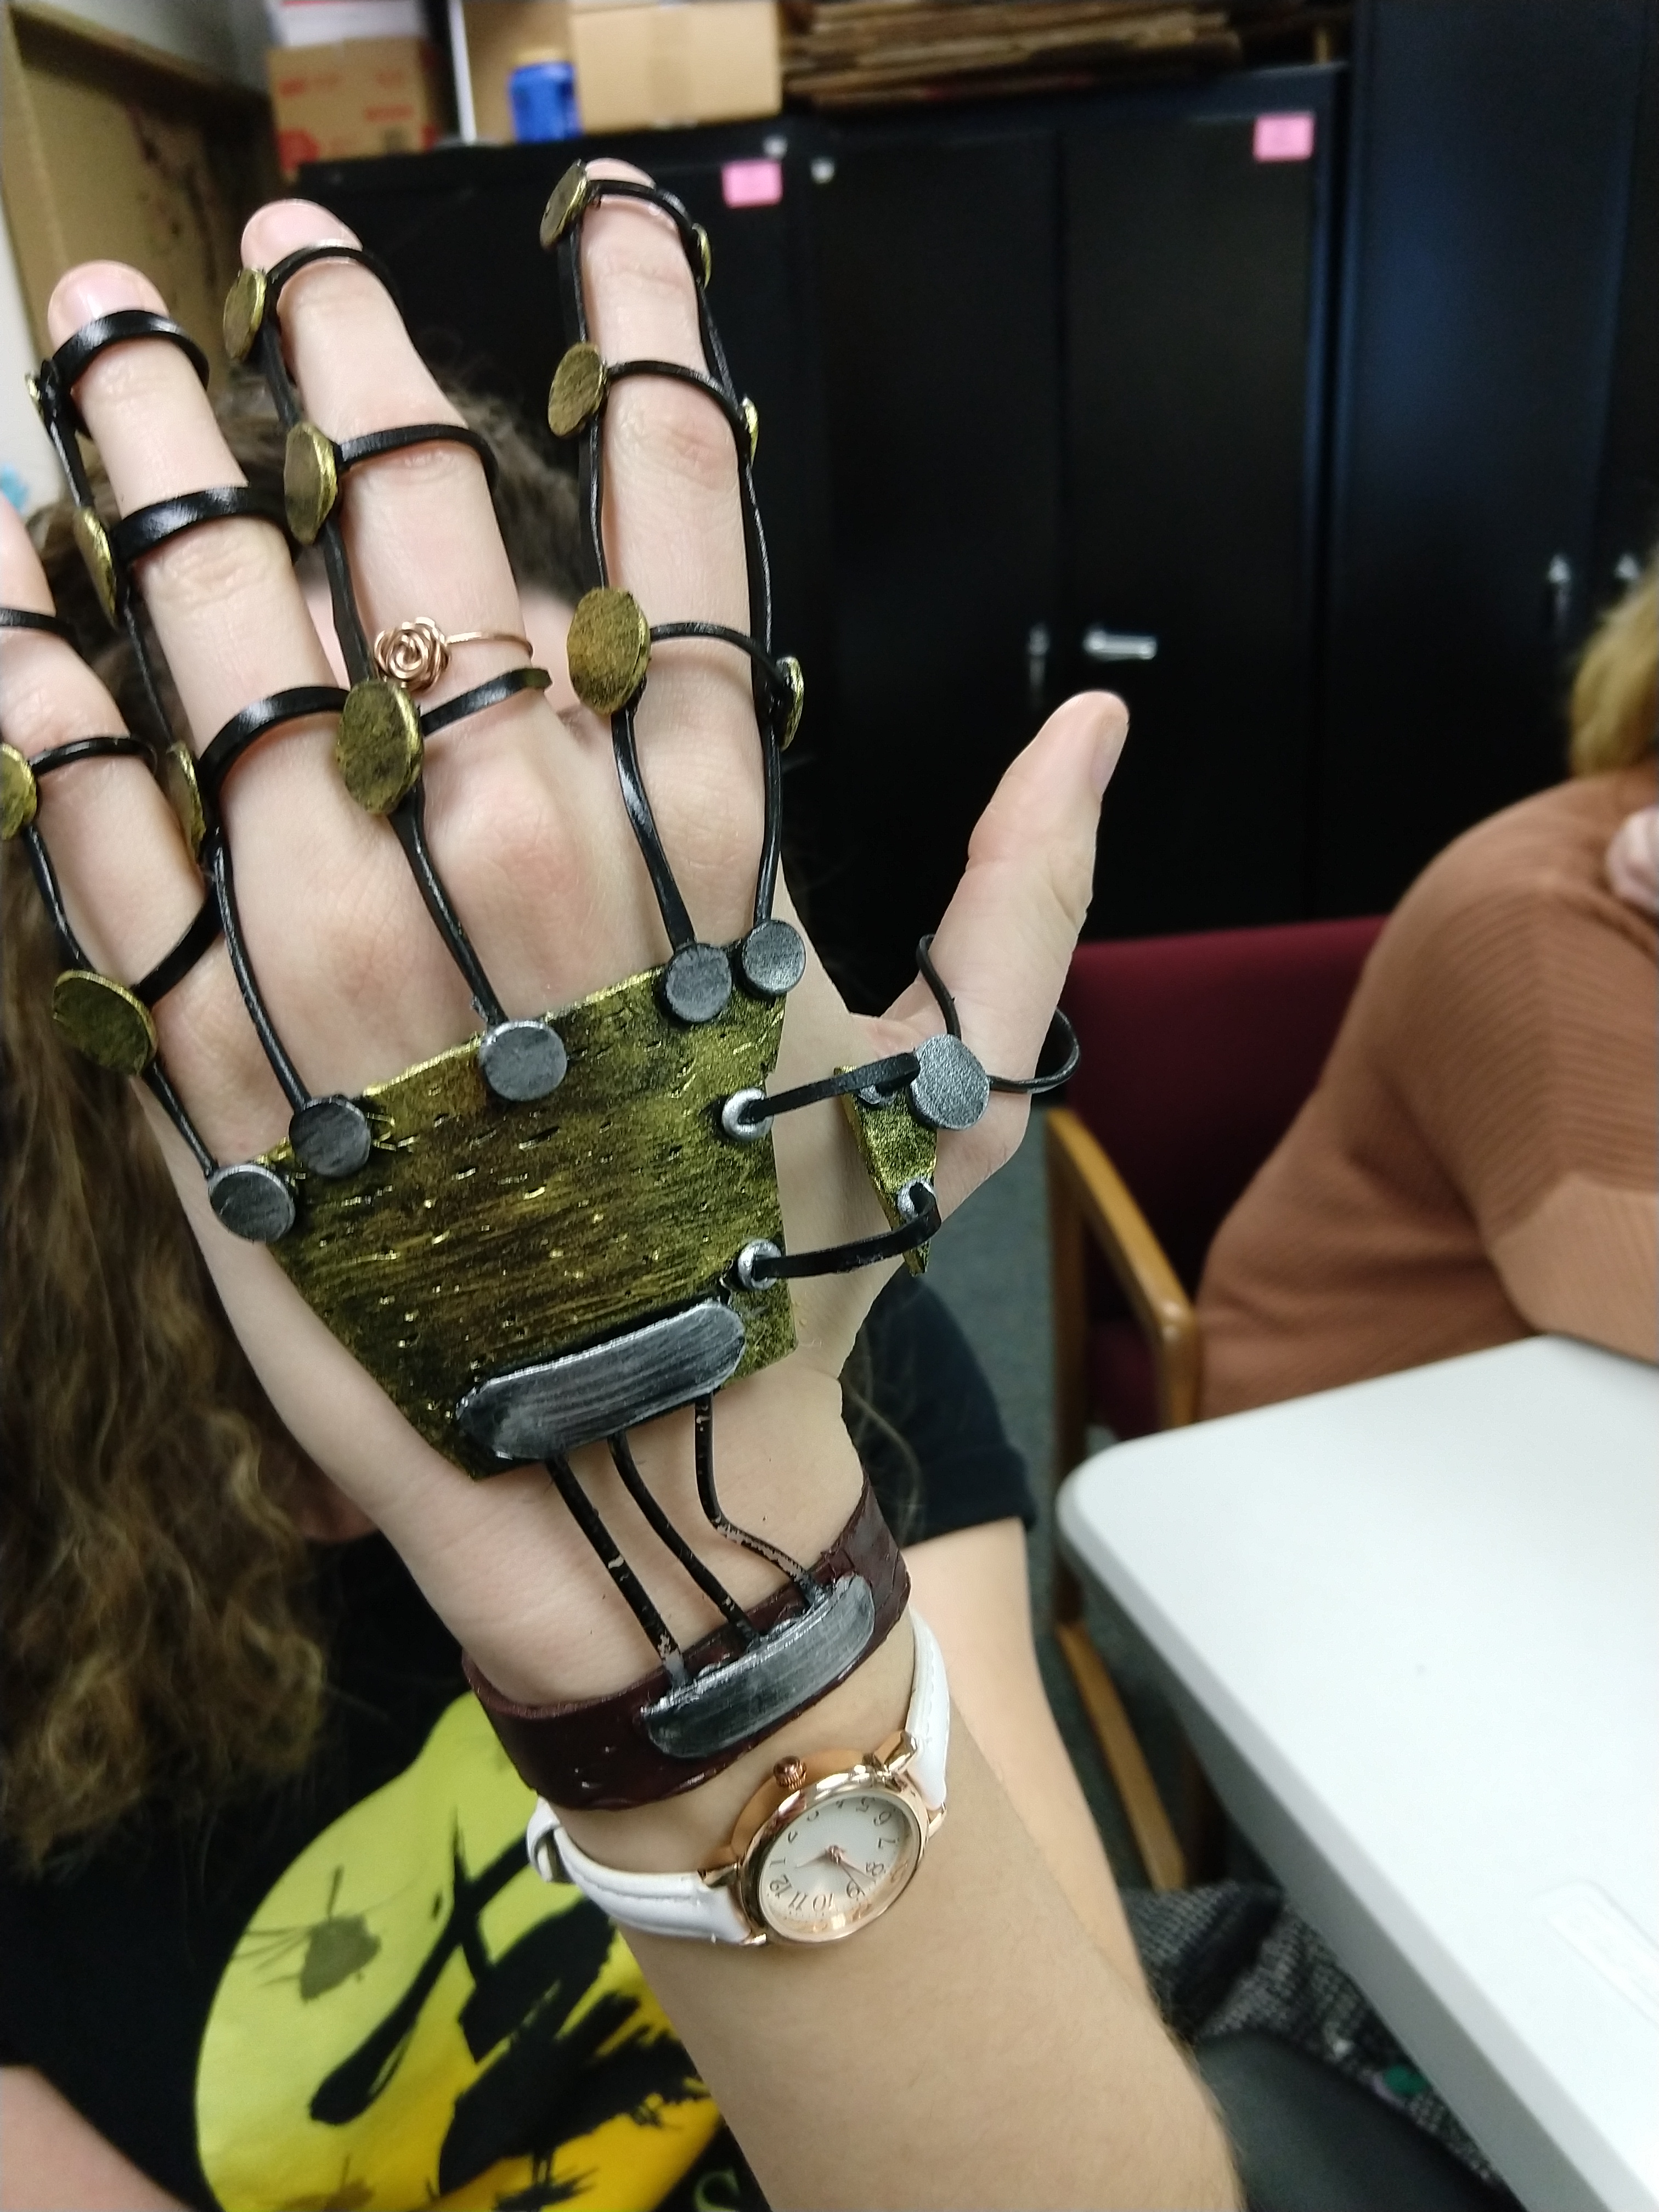
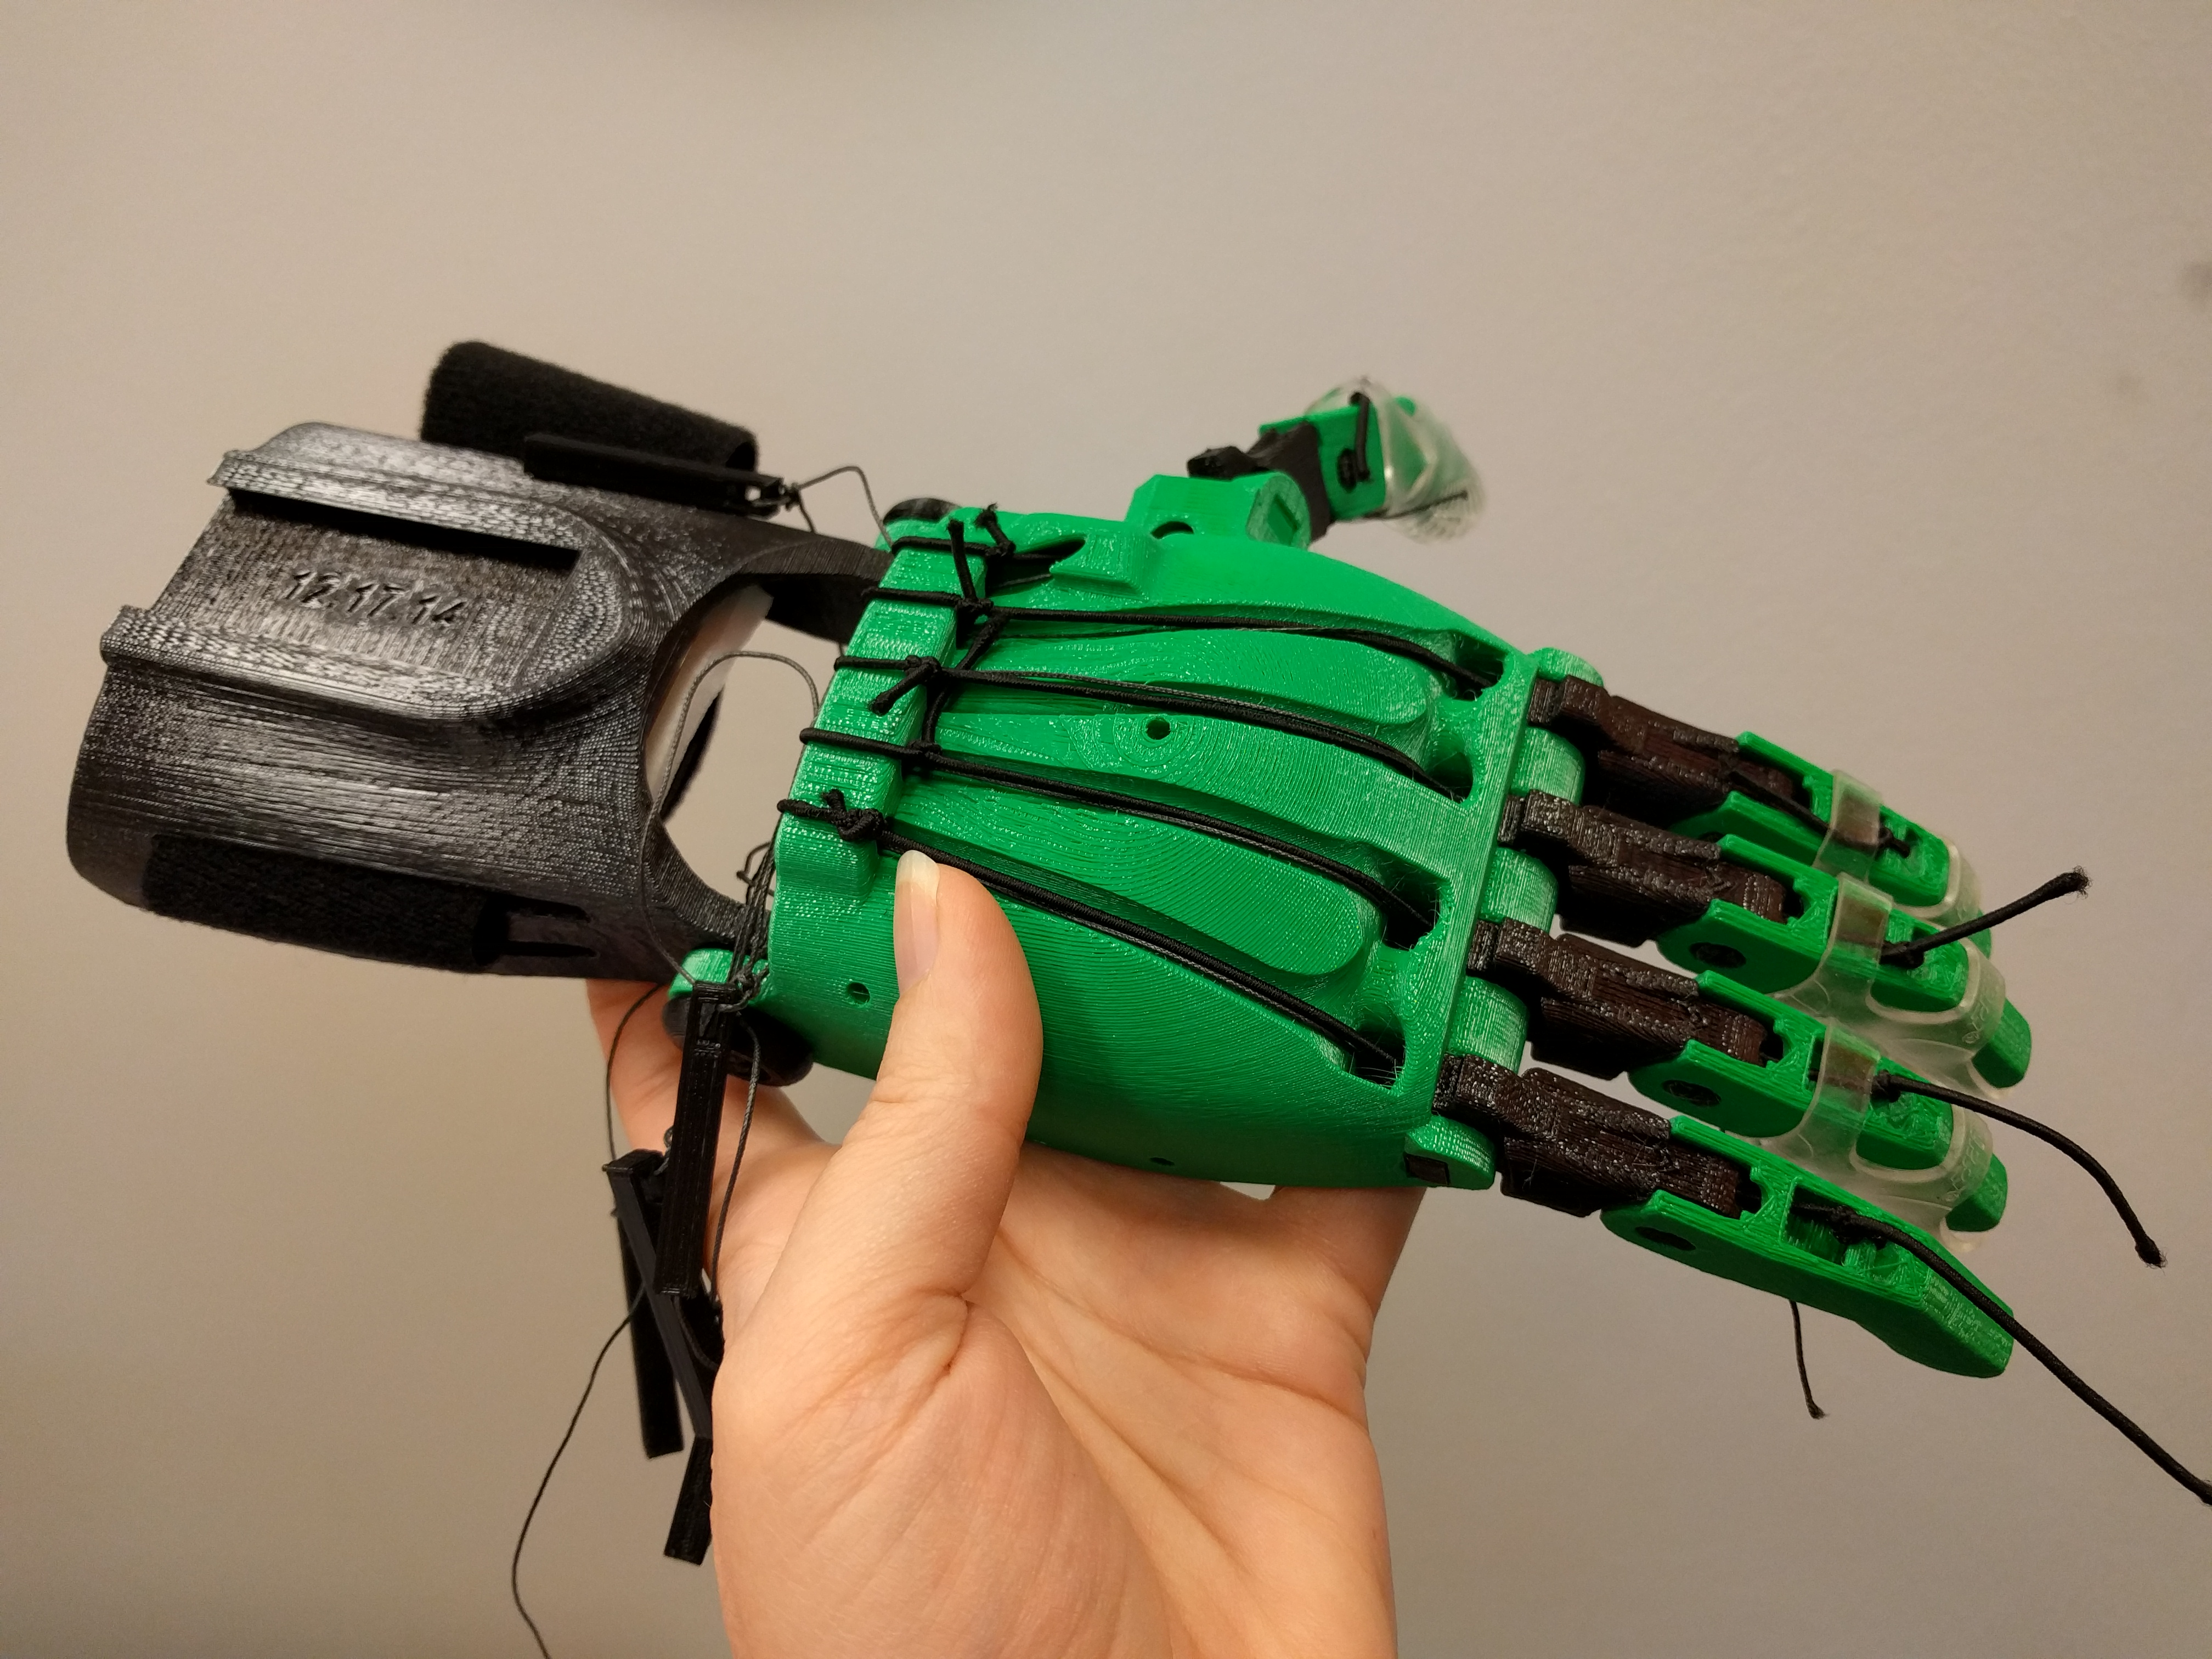
The 3D design unit included recyclables, modeling clay, drawing with hot glue and 3D pens, 3D CAD modeling, and 3D printing.
Electronics and interactive unit
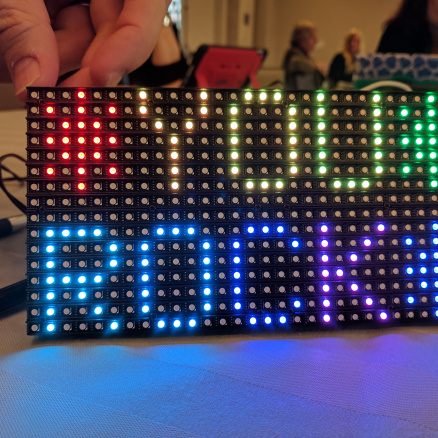
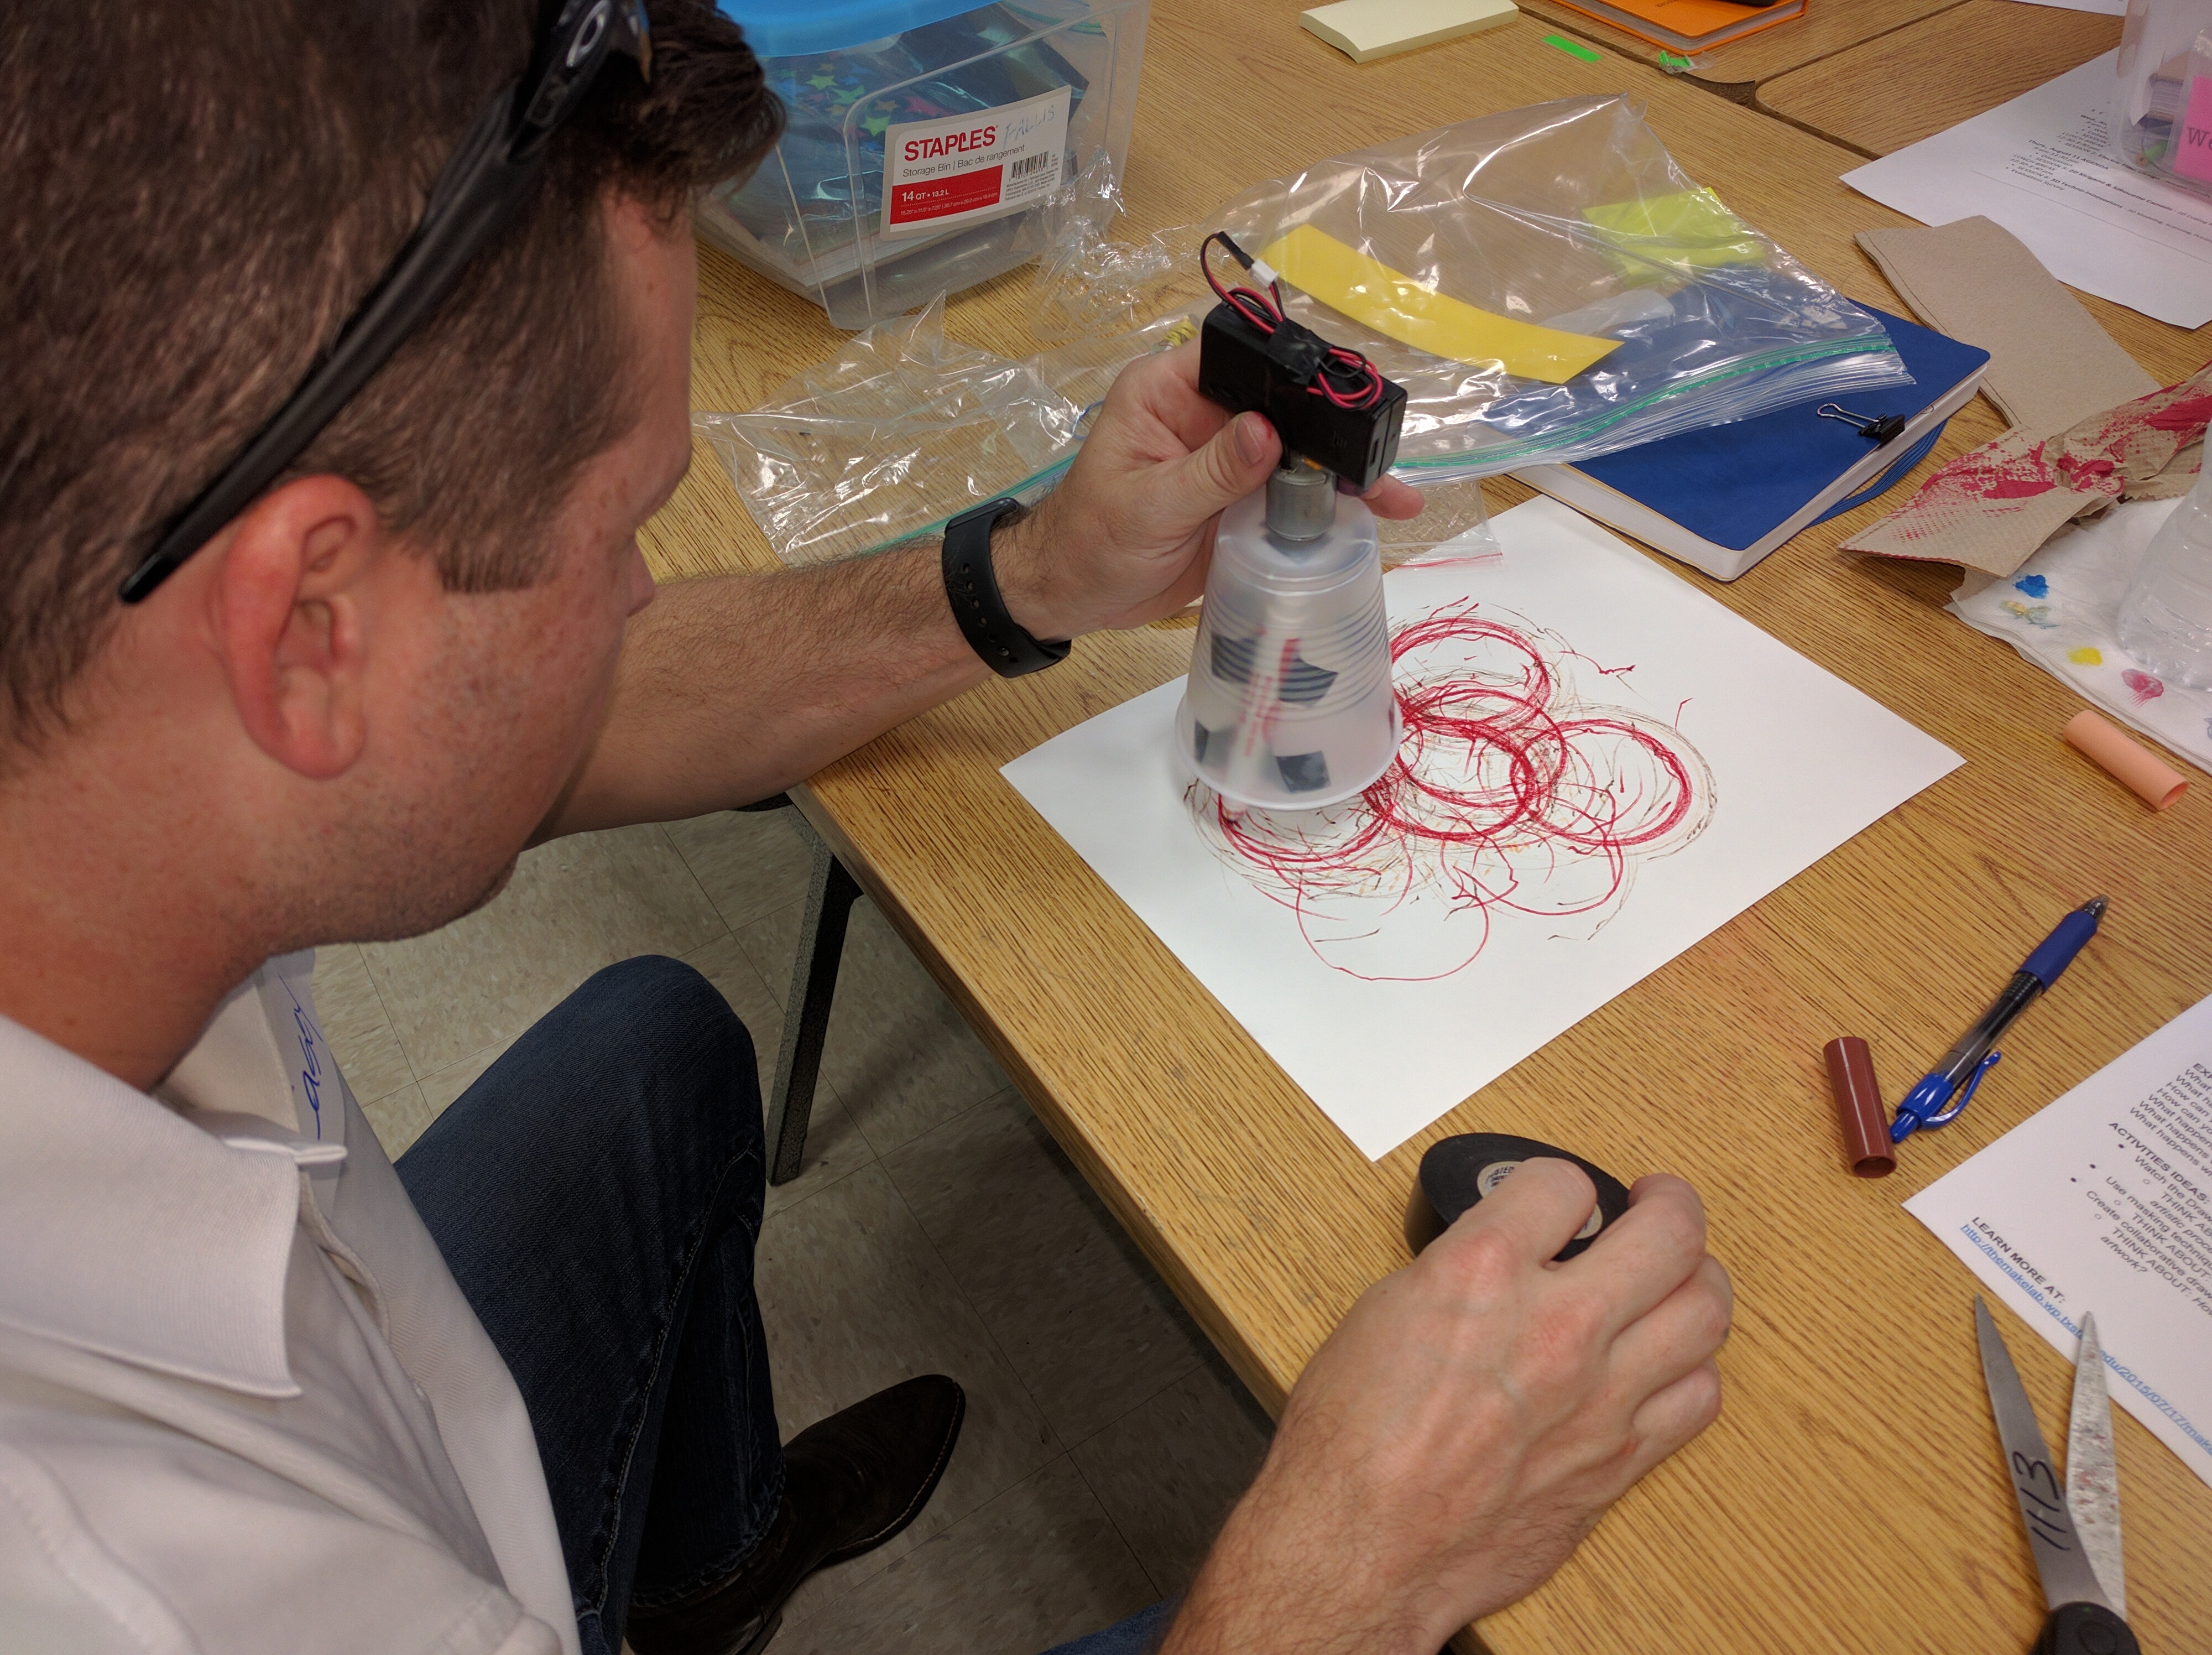
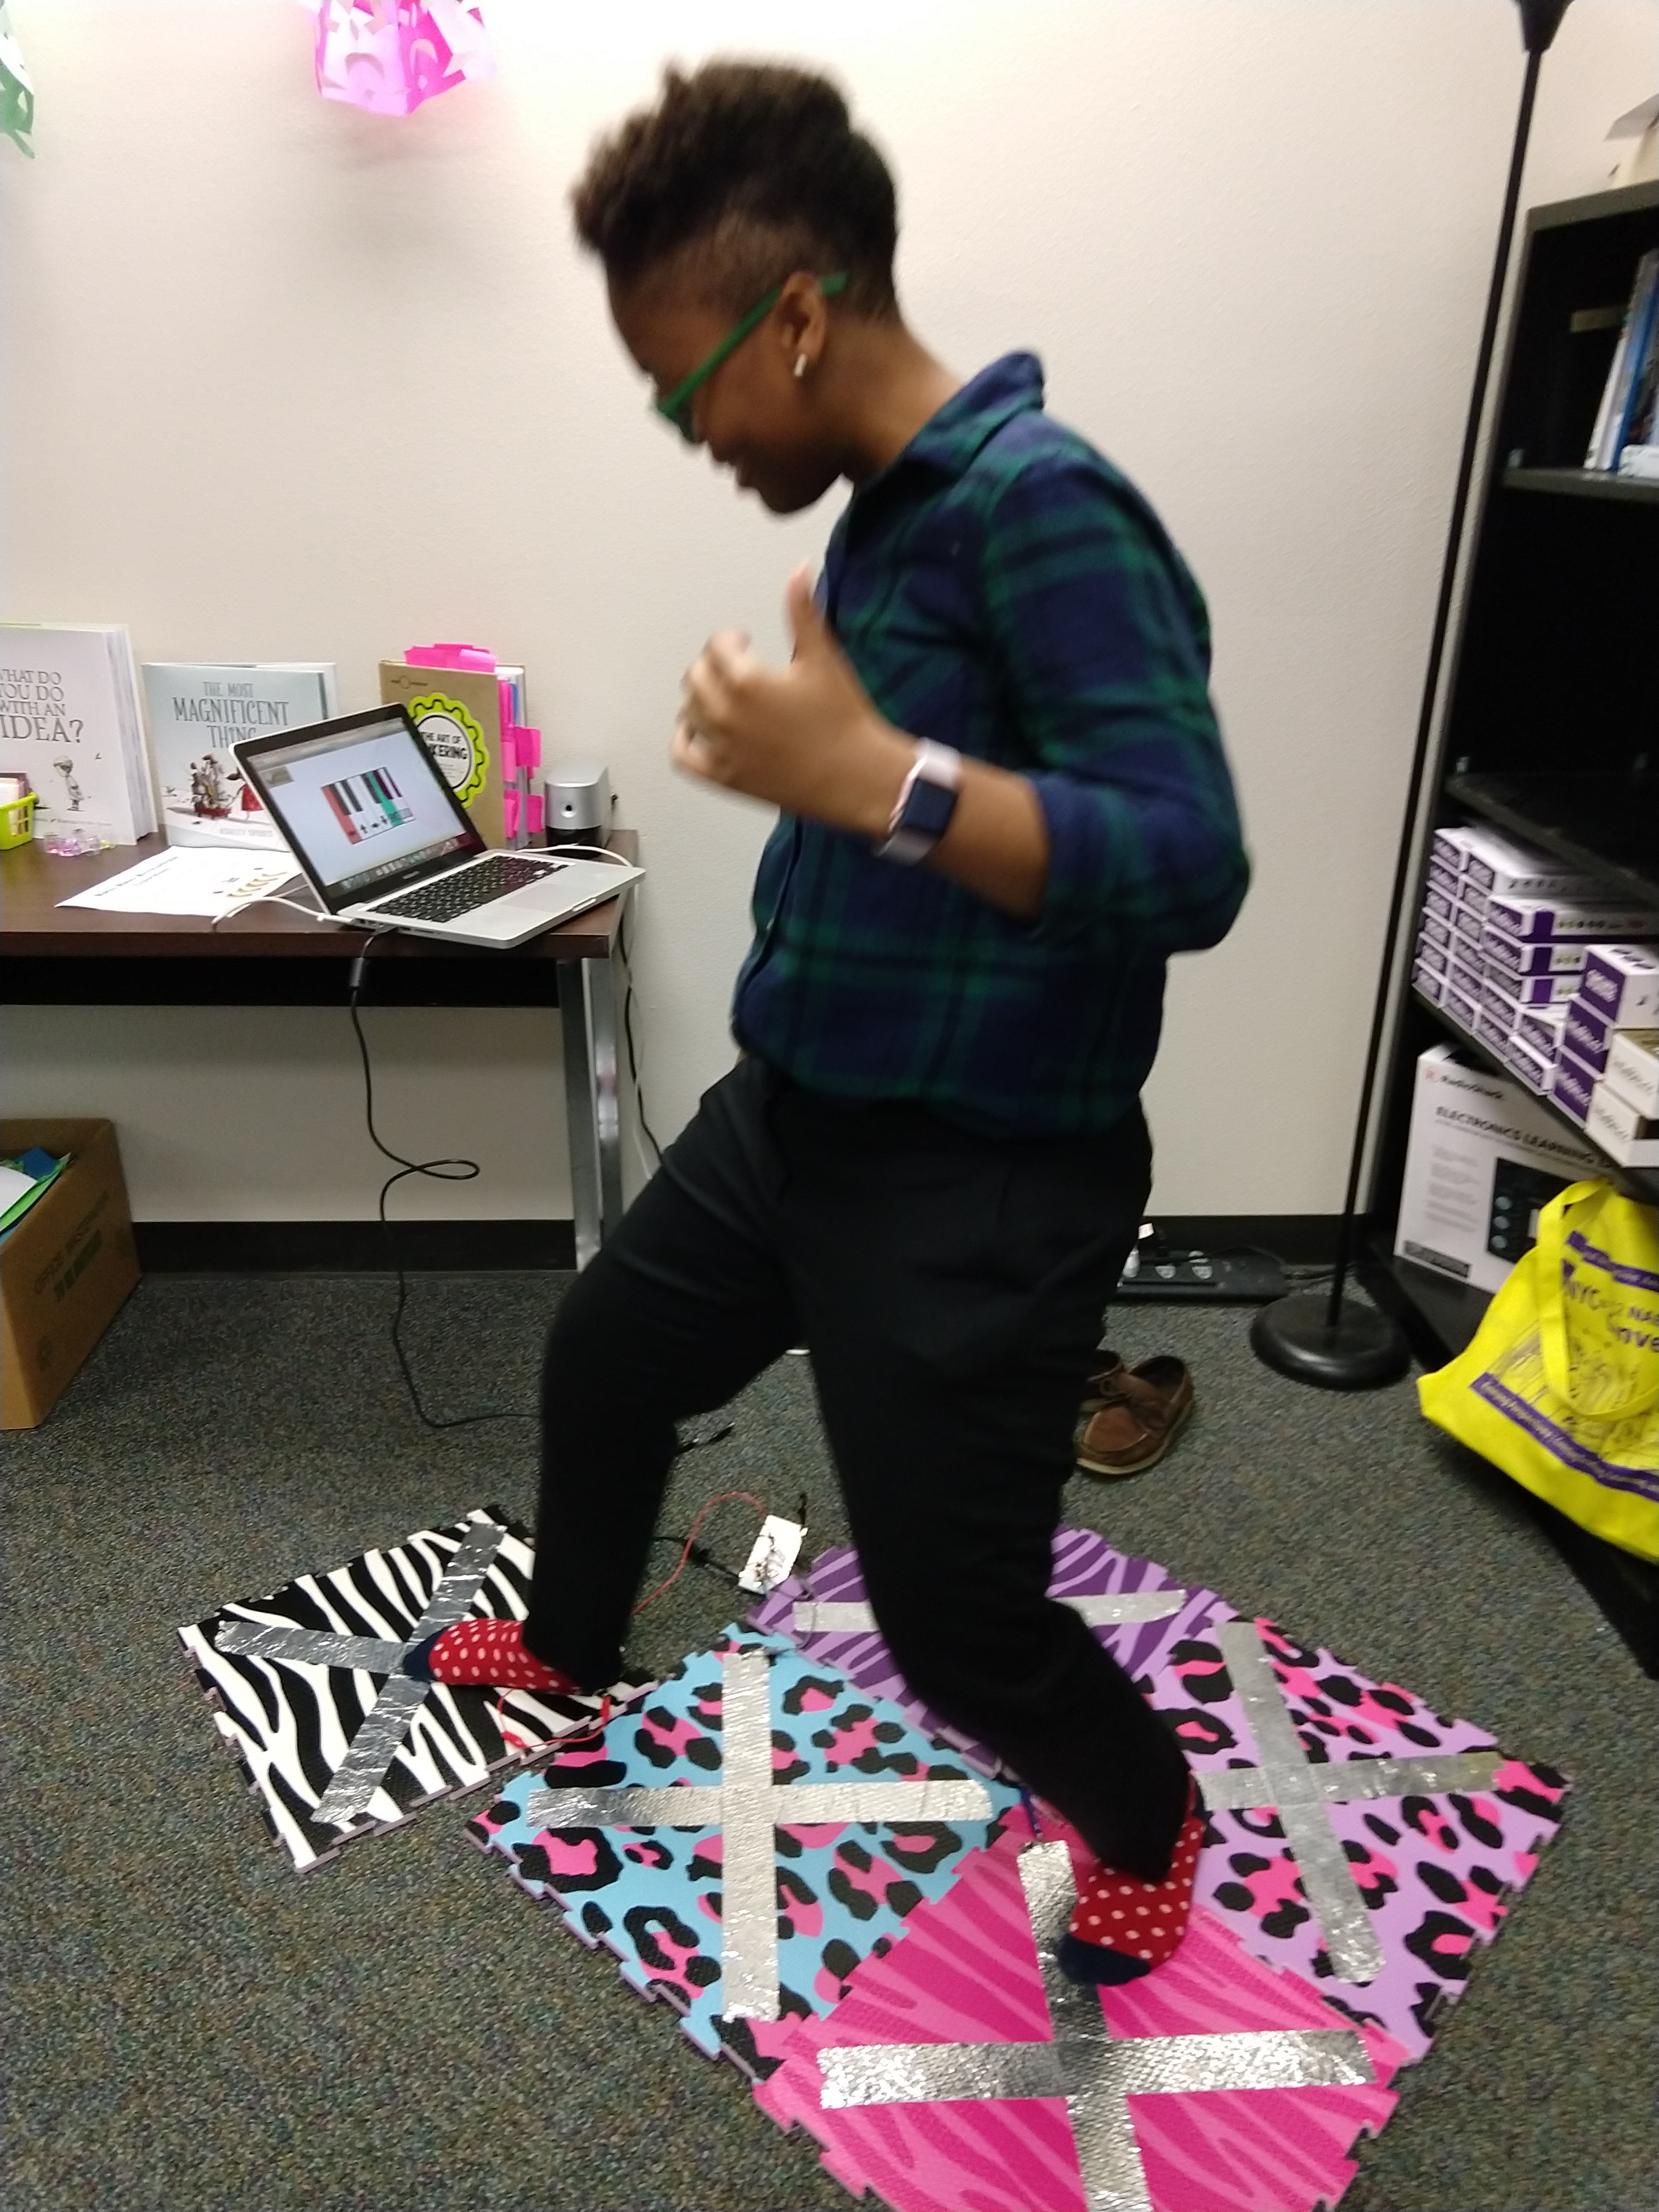
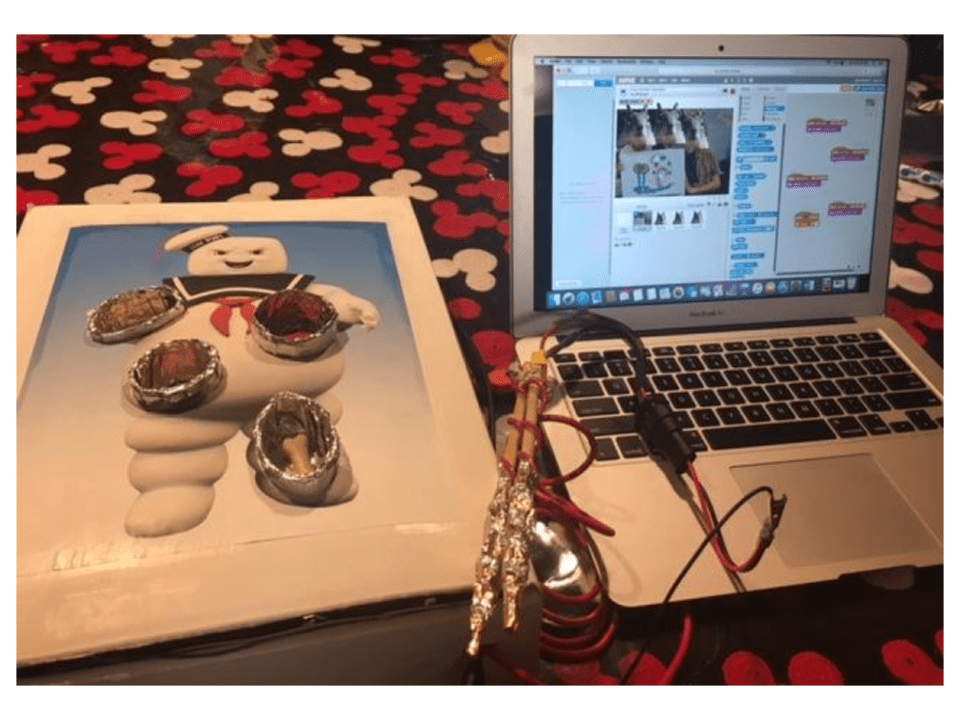
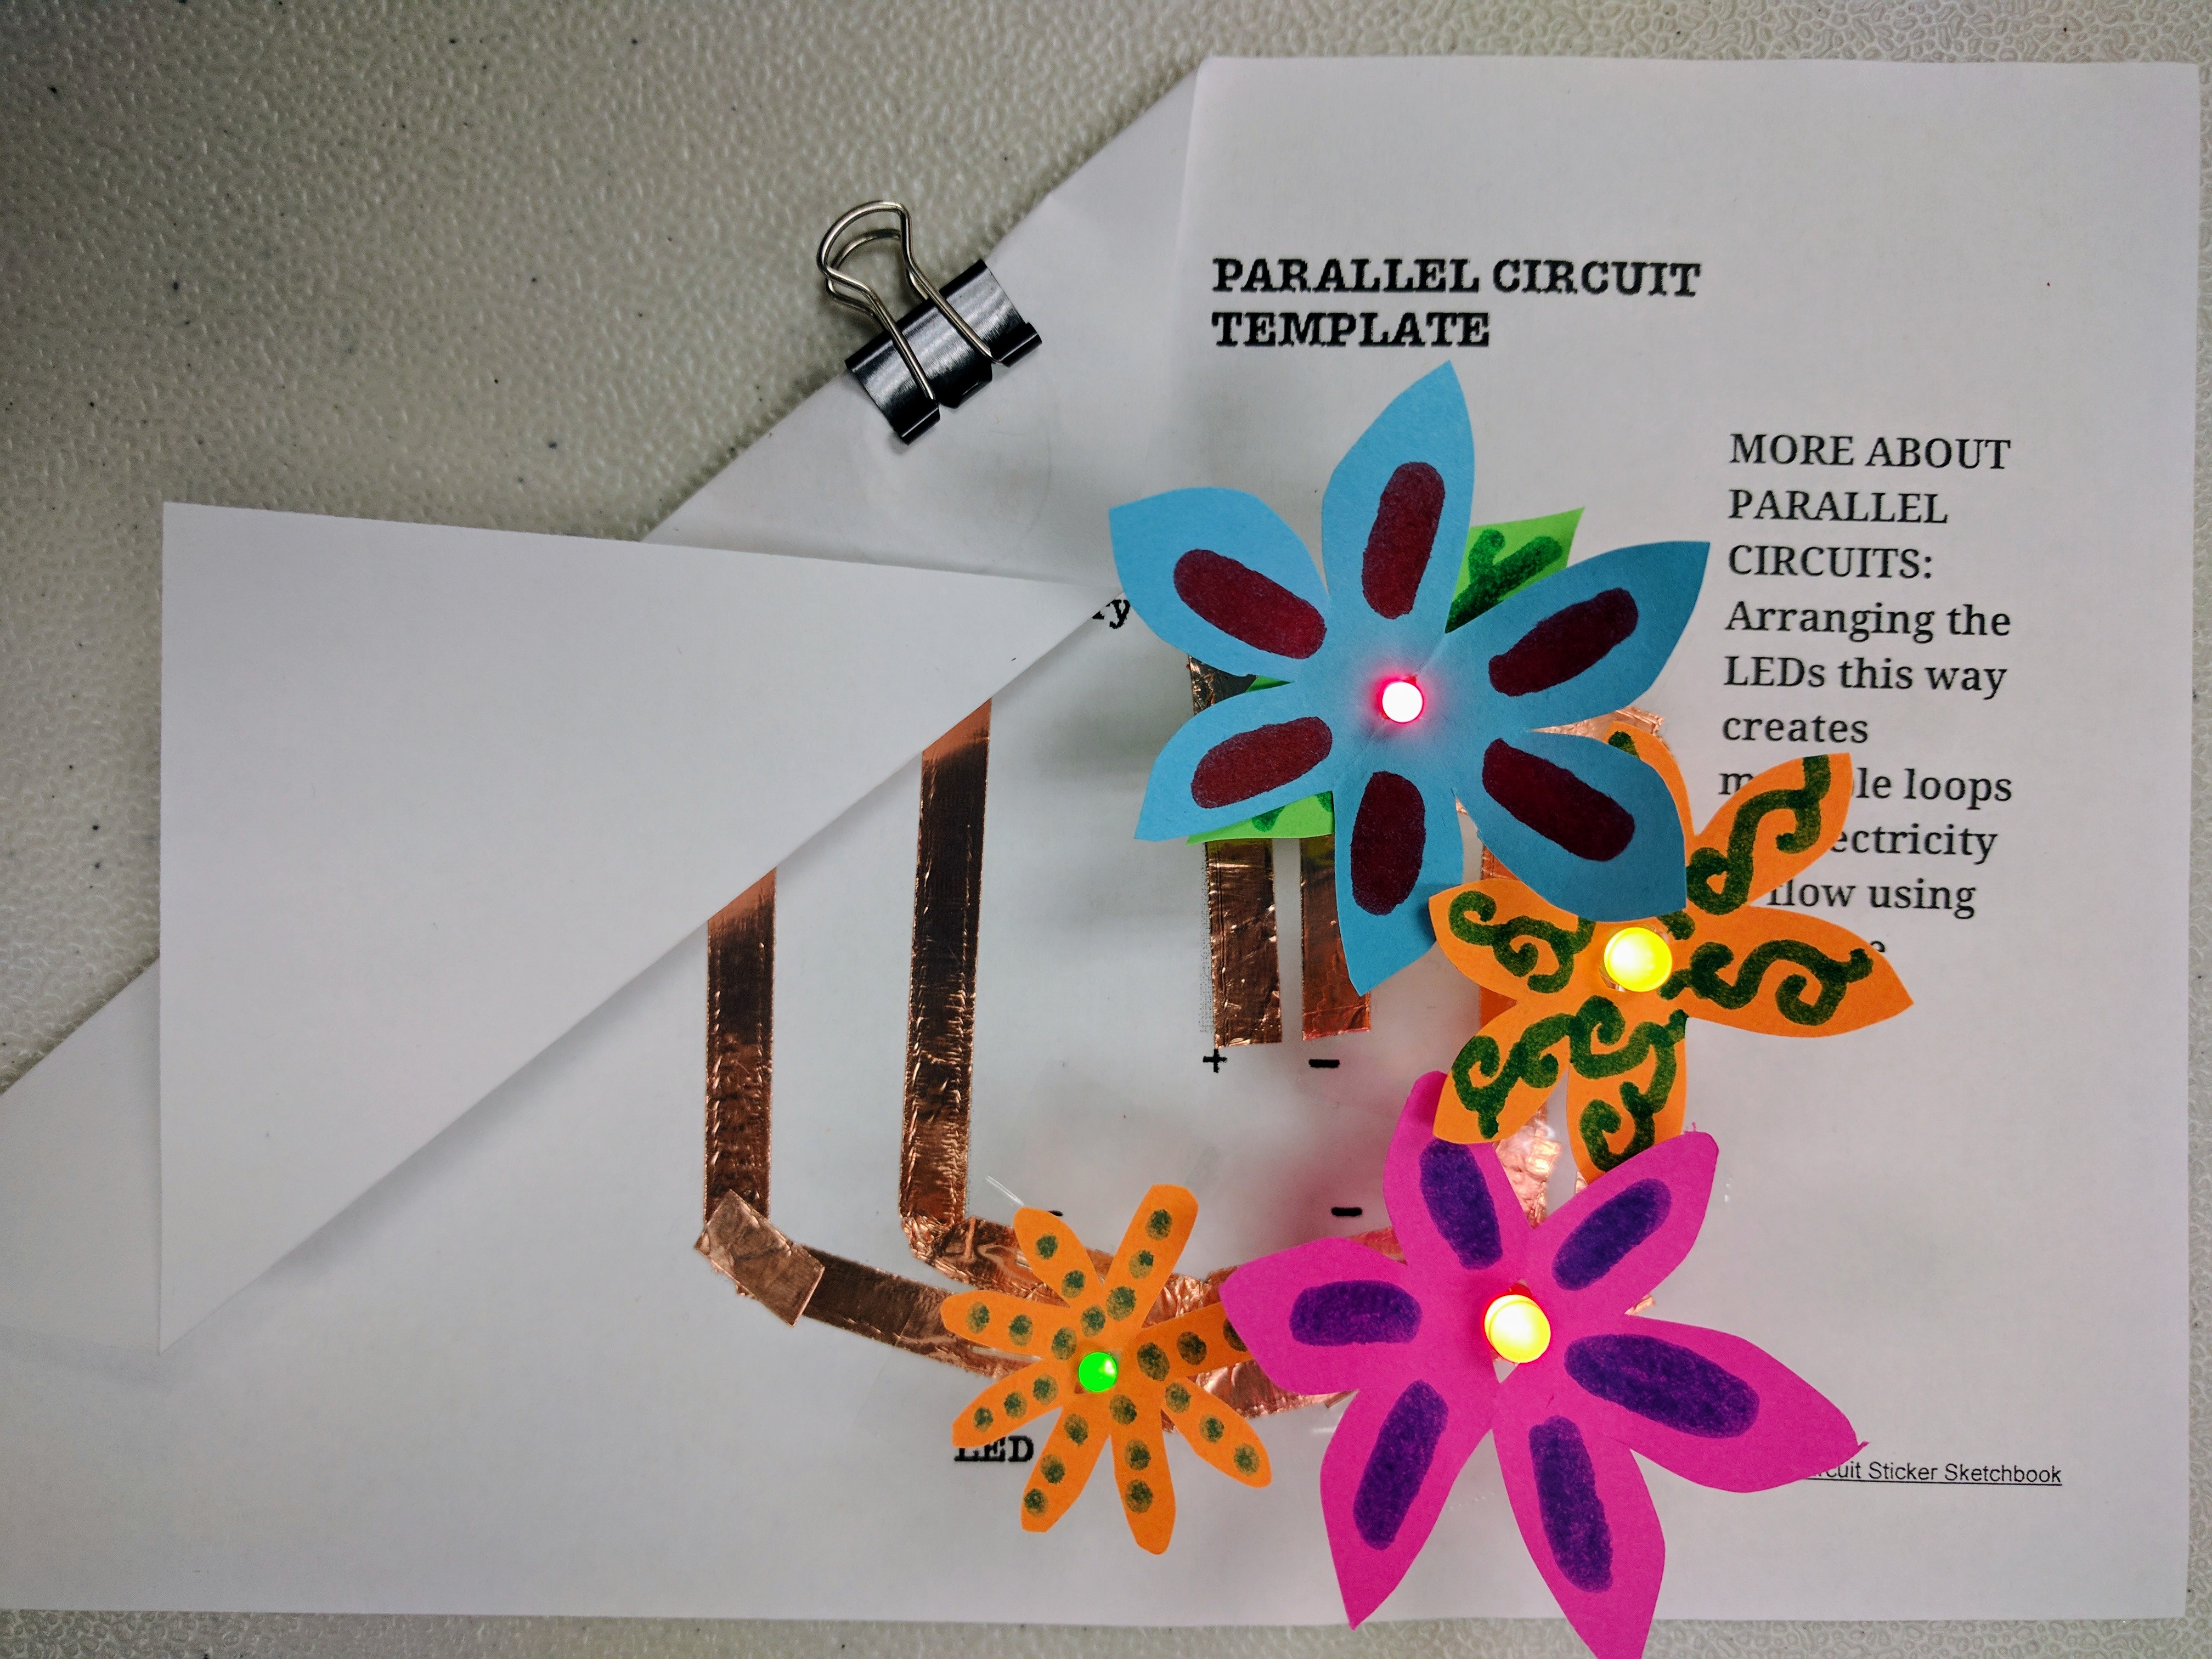
The electronics and interactive unit included LEDs, pager motors, paper circuits, sewable circuits, microcontrollers, and programming.

Impact
The creative learning that took place in this course has been documented in several of my qualitative publications:
Smith, S., Talley, K., Ortiz, A., & Sriraman, V. (2021). You want me to teach engineering?: Impacts of recurring experiences on K-12 teachers’ engineering design self-efficacy, familiarity with engineering, and confidence to teach with design-based learning pedagogy. Journal of Pre-College Engineering Education Research (J-PEER). 11(1), Article 2. Available at: https://doi.org/10.7771/2157-9288.1241
Smith, S. & Rodriguez, S. (2021). Exploring ambiguity tolerance during the adoption of maker-centered learning tools and strategies. Tech Trends.
Cohen, J., Jones, M. & Smith, S. (2018). Preservice and early career teachers’ preconceptions and misconceptions about making in education. Journal of Digital Learning in Teacher Education. 34(1), 31-42. Available at: https://doi.org/10.1080/21532974.2017.1387832
Jones, M., Smith, S., & Cohen, J. (2017). Pre-service teachers’ perceptions of using maker activities in formal educational settings. Journal of Research on Technology in Education. 49(3-4), 134-146. Available at: http://www.tandfonline.com/doi/full/10.1080/15391523.2017.1318097
Smith, S. & Henriksen, D. (2016). Fail again, fail better: Failure as a paradigm for learning and the arts. Art Education Journal. 69(2), 6-11. Available at: https://doi.org/10.1080/00043125.2016.1141644
Smith, S. (2015). Epic fails: Reconceptualizing failure as a catalyst for developing creative persistence within teaching and learning experiences. Journal of Technology and Teacher Education, 23(3), 329-355. Chesapeake, VA: Society for Information Technology & Teacher Education. Available at: https://www.learntechlib.org/primary/p/151569
Empowering teachers to solve local problems with design thinking
Project overview
This course was offered to graduate-level Educational Technology M.Ed. students, which focused on using the design thinking process to develop technology implementation solutions for existing problems that the students identified in their own K-12 classroom context. This included empathizing, scoping, conducting research, prototyping, iterating, and socializing insights. Students presented their final projects at a free EdTech professional development conference, which the class planned and hosted as a class.
Impact
Developed and taught a design thinking course, which provided a mentorship structure that enabled 45 teachers to create and refine products and services to solve problems in their schools.
My role
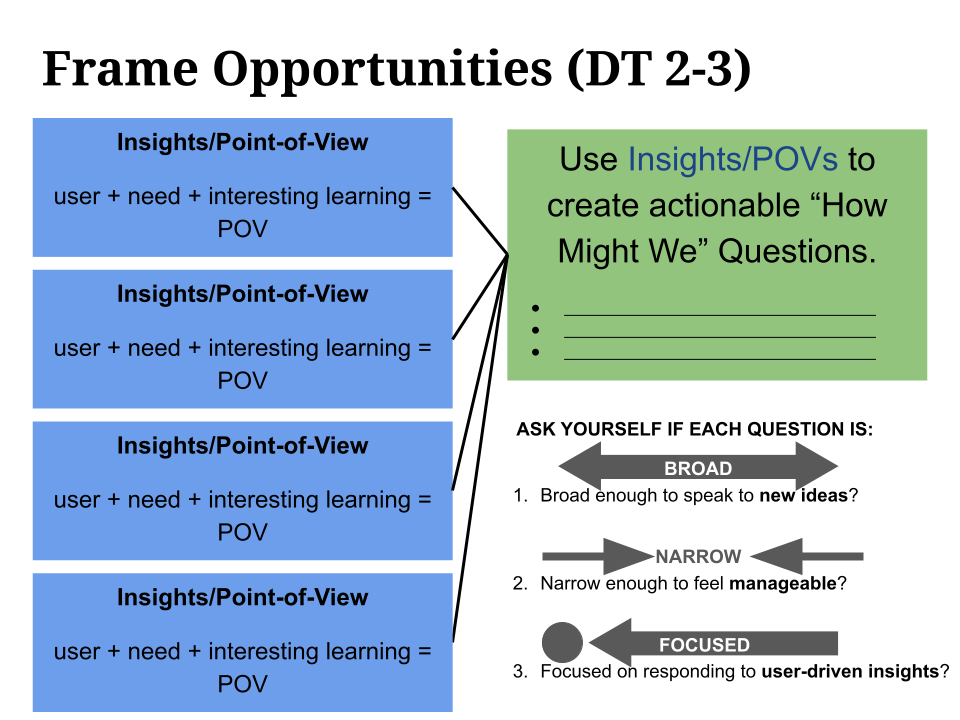
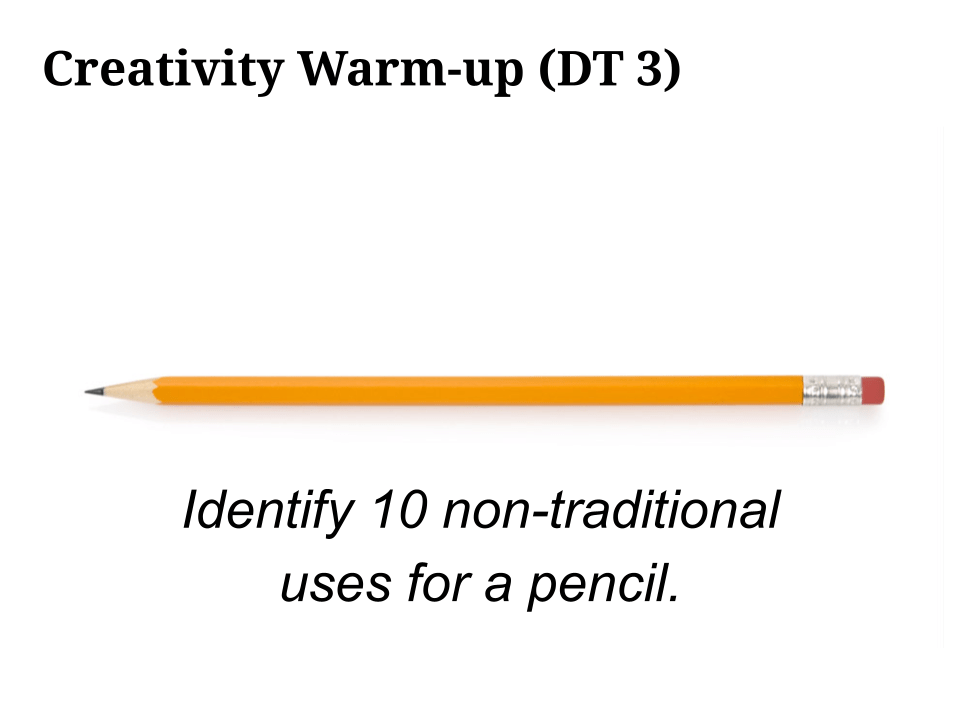
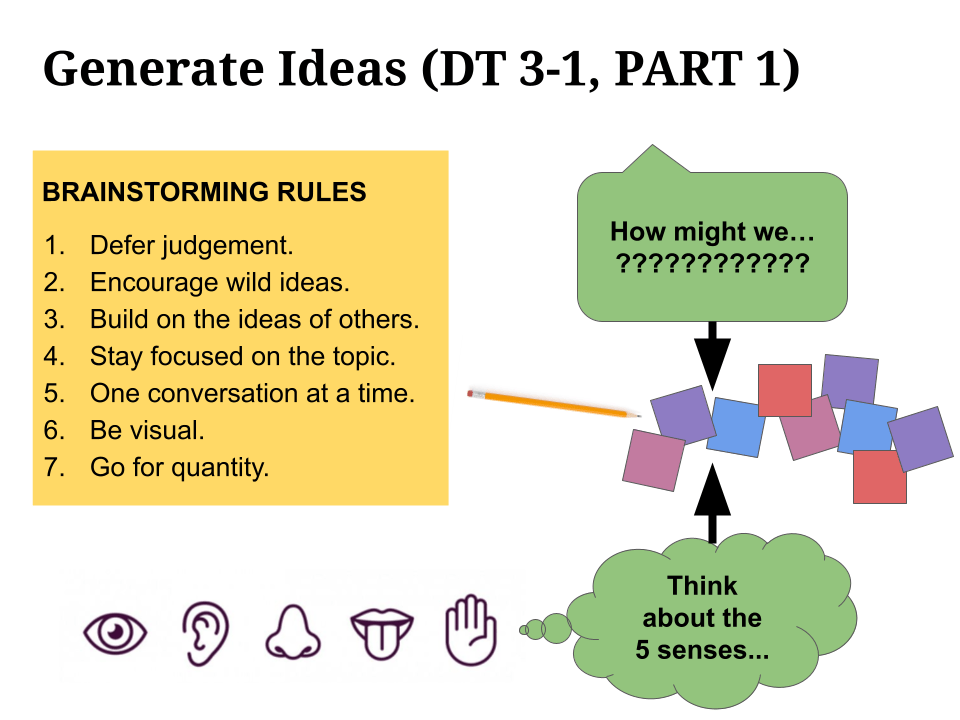
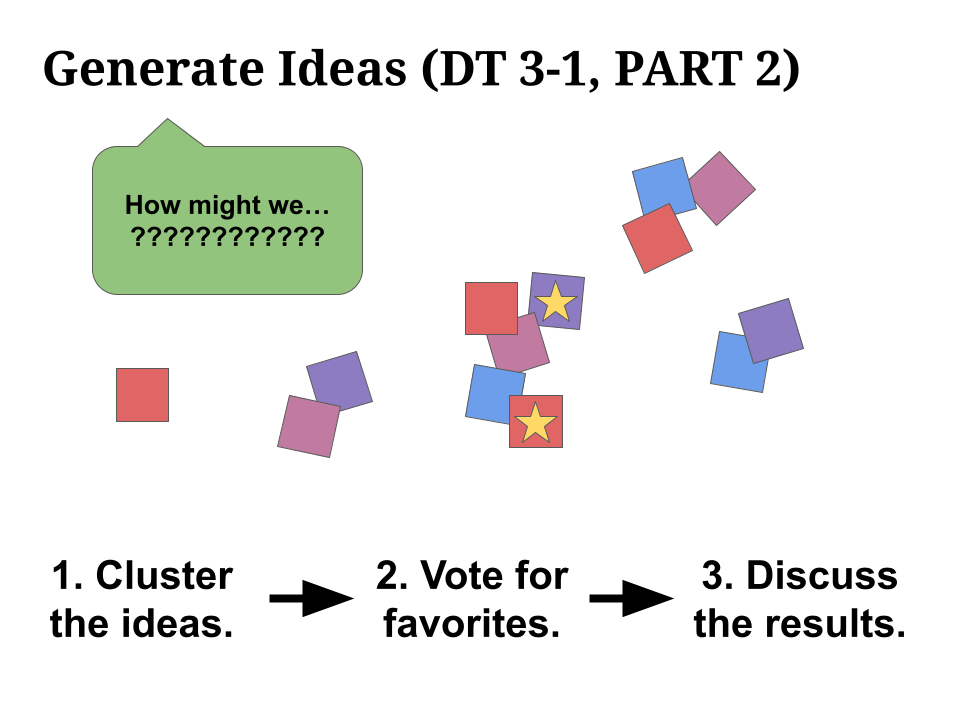
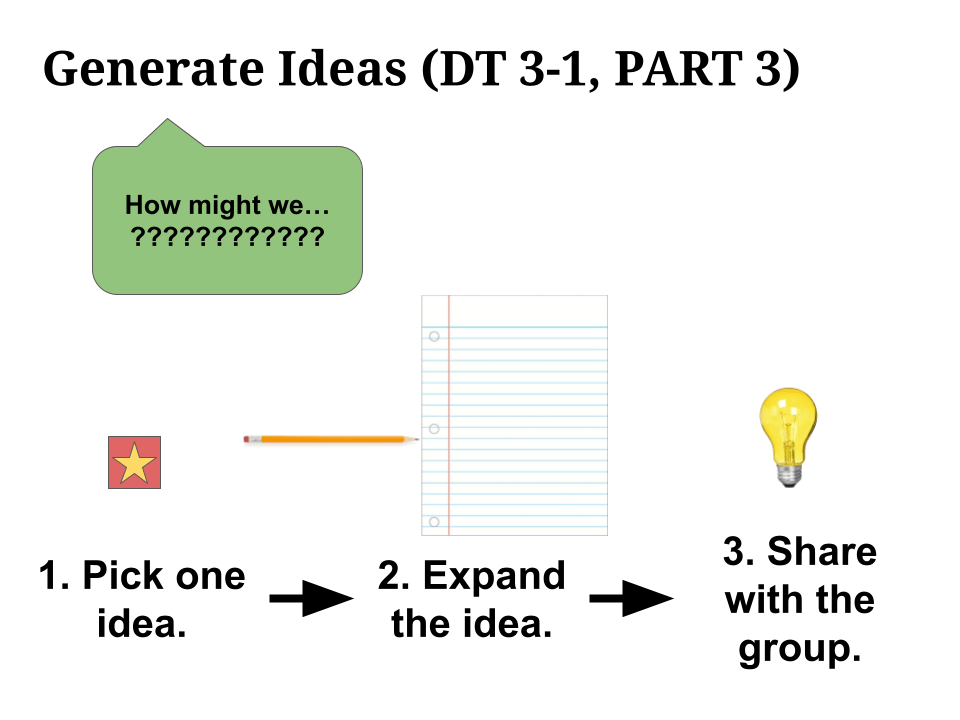
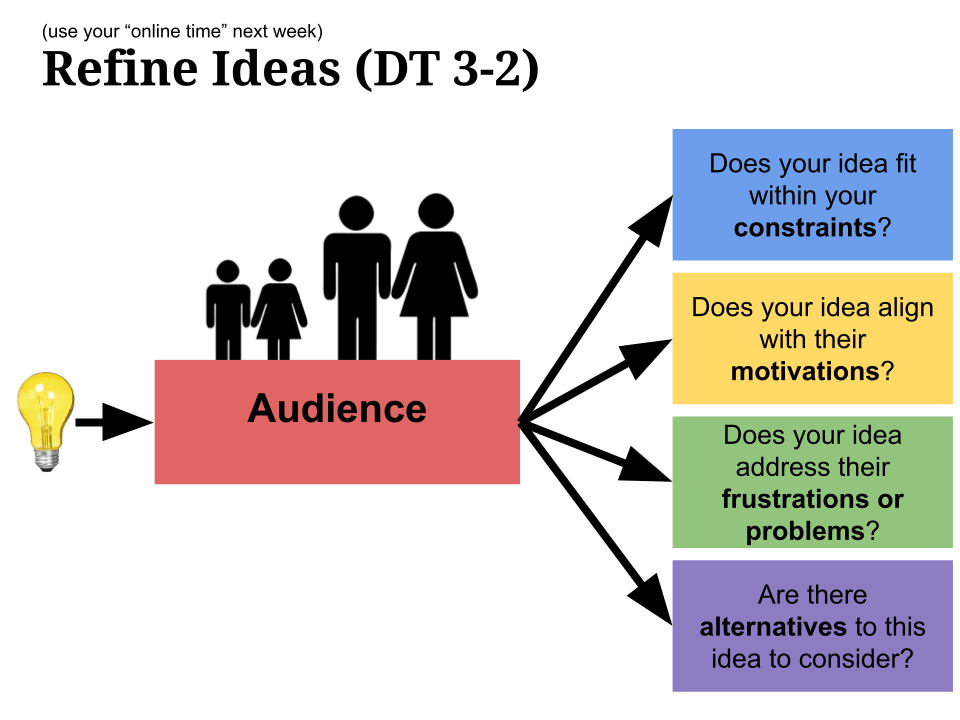
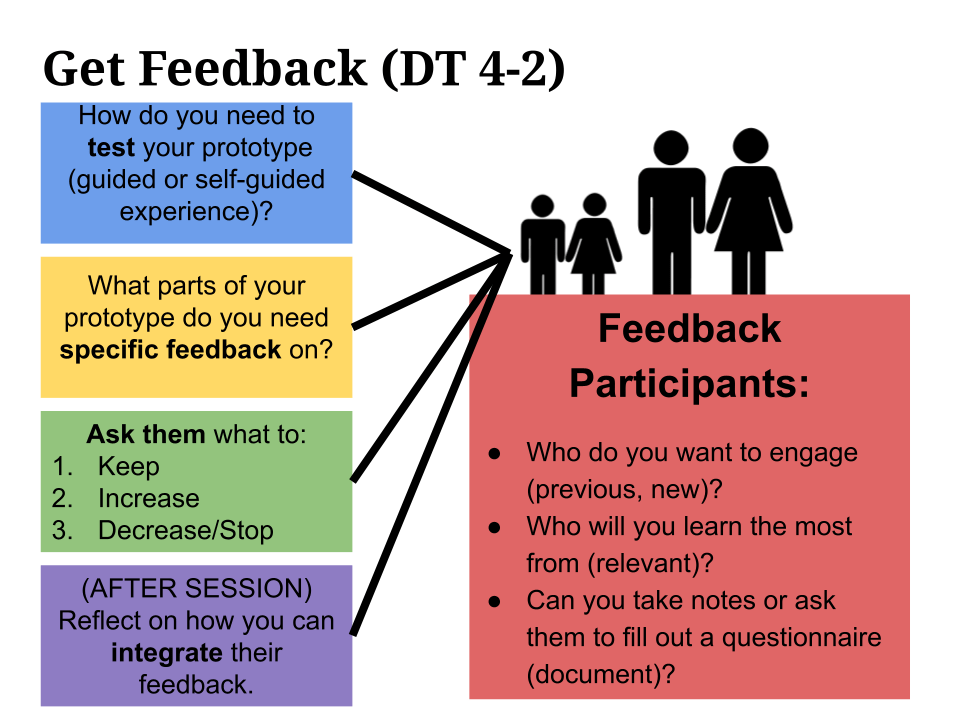
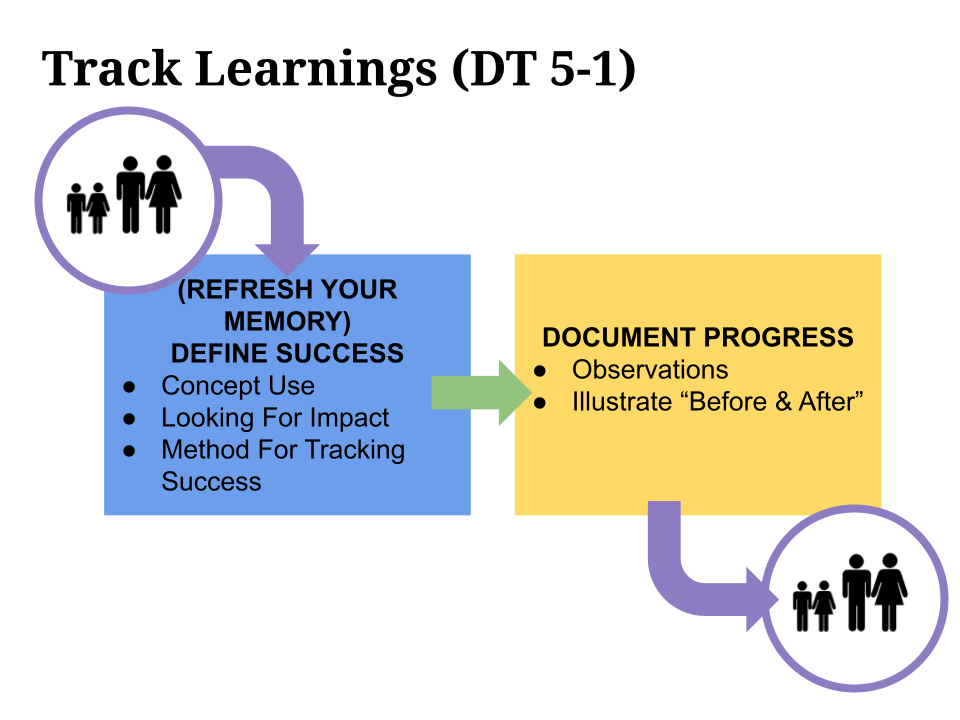
As professor of the course, I developed the curriculum including in-class activities, formative homework assignments, and summative projects. IDEO’s Design Thinking for Educators served as the primary resource, which was modified to guide students through the design thinking process. I facilitated a variety of activities to inspire creative thinking (e.g., 30 circles, word association), brainstorming (e.g., crazy 8s, color coded post its activities, interactive whiteboard discussions), data collection (e.g., interview, focus group, observation, survey), synthesis (e.g., dot voting, affinity mapping), prototyping (e.g., low-fidelity sketches, mid-fidelity mockups), user testing, iteration, and communication to stakeholders (e.g., infographics, slides, videos).
Below you can see examples of curriculum and class activity resources.
Impact
I mentored 45 teachers to create products and improve service designs to solve problems in their schools through leveraging strategies taught in this design thinking course. Examples of students projects include:
- Redesigning a High School AP Physics Course to Increase Engagement and Collaboration
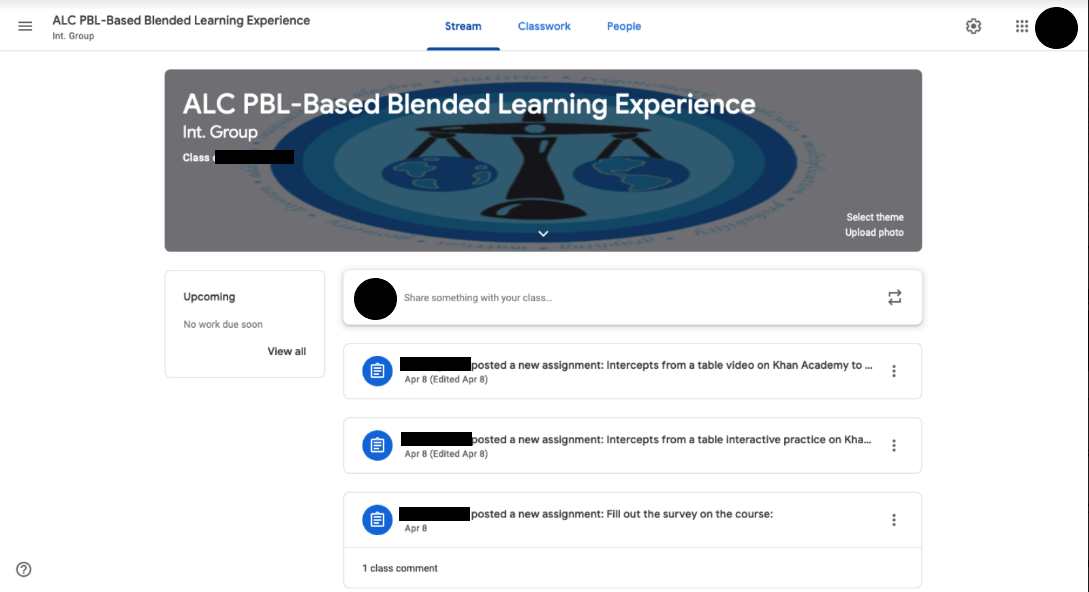
- Developing an Online System to Engage At-Risk Youth in the Power of Math, PBL, and Blended Learning
- Developing a Portuguese Afterschool Program at a Local Community Center
- Developing an Online Portfolio Building Portal for Students to Document Differentiated Mathematics Learning

If you build it, they will read: Using design thinking to engage student reading
Project overview
This project involved the development of a learning experience in a newly developed elementary library makerspace to support student engagement in reading. Taking inspiration from an existing research-proven activity concept, Novel Engineering, a hands-on event was developed and facilitated to inspire more students to participate in the school’s reading challenge. The process used design thinking to uncover what some of the pain points were for the librarian and students, identify student interests, conduct and evaluate a pilot with students, iterate procedures based on pilot, and implement final experience with school.
My role
I consulted with the librarian, which included observing needs, identifying opportunities, and designing options for facilitating creative literacy-building activities using safe materials that the elementary students could easily use with minimal adult assistance.
Process details
Collaborative planning
While the librarian enjoyed the students’ use of the new library makerspace area, she continued to wonder how to engage more students in reading-related activities. She not only wanted to increase general enthusiasm toward reading but she also wanted to increase participation in the annual state book award reading contest (i.e., students earn points by reading award winning books and completing an online reading comprehension test about the book).
Ethnographic observations
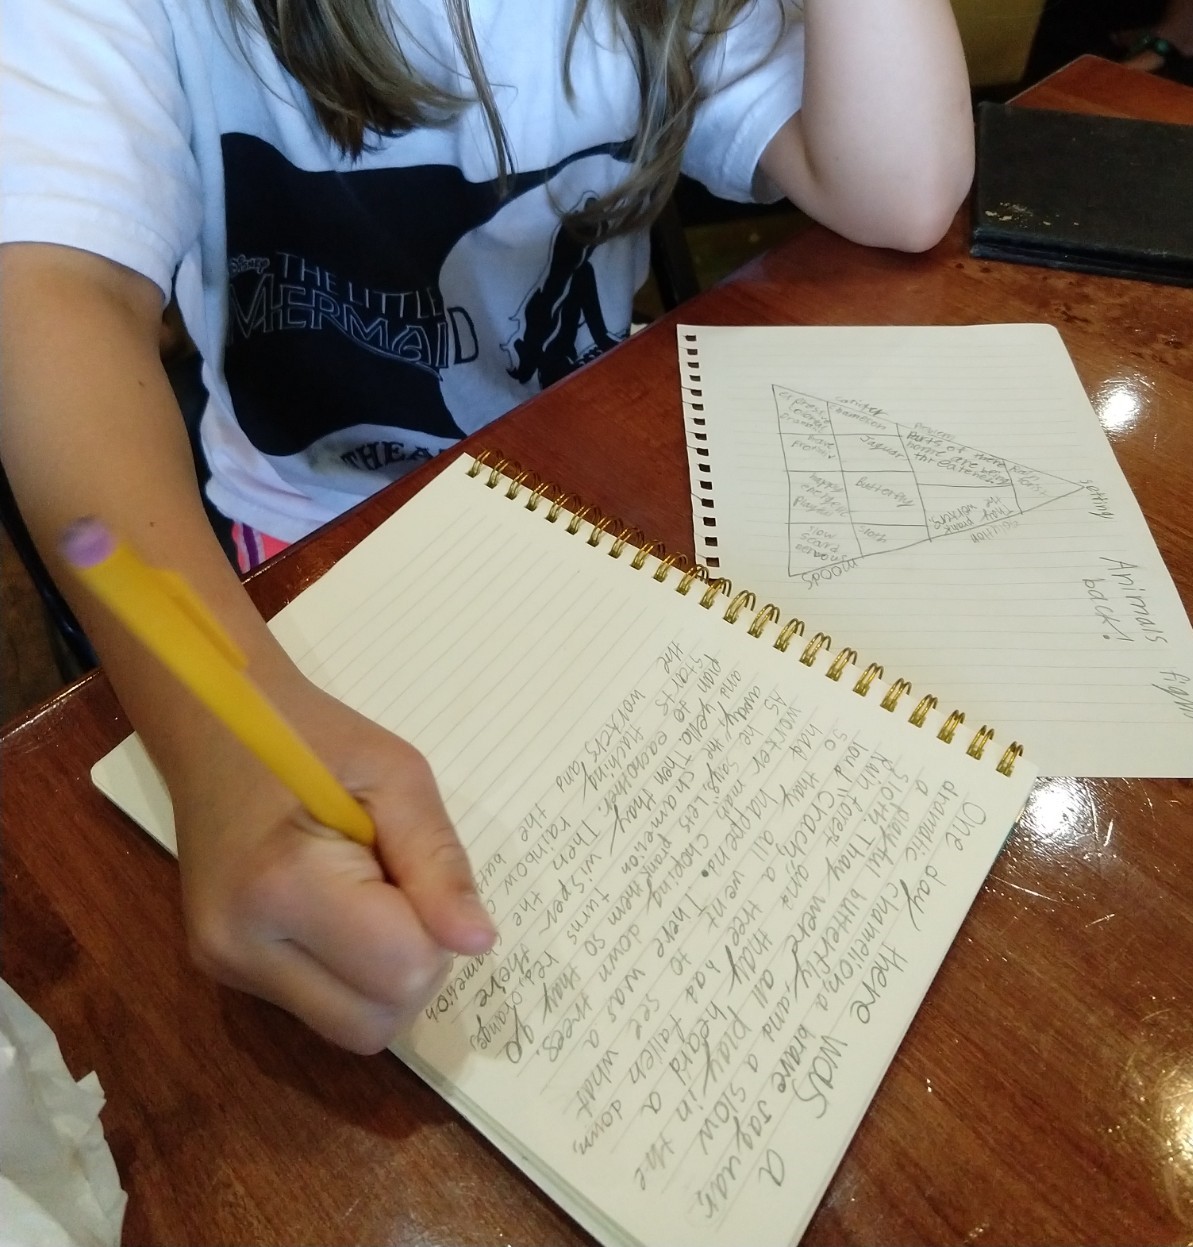
The first step in the process included conducting research in the library to observe student reading habits. I observed that the students gravitated to certain types of books, including the state award winners and graphic novel collections. Upon asking a few of the students casual questions, I discovered that many students wanted to participate in the annual state book award contest; however, they were only interested in certain books that always seemed to be checked out. Several students expressed that they enjoyed graphic novels because of the visual illustrations with playful storylines but that only a few of the state award winners were graphic novels. Additionally, I noticed some students in the self-directed makerspace area writing their own stories and creating unique objects with craft materials to accompany stories that they had written.

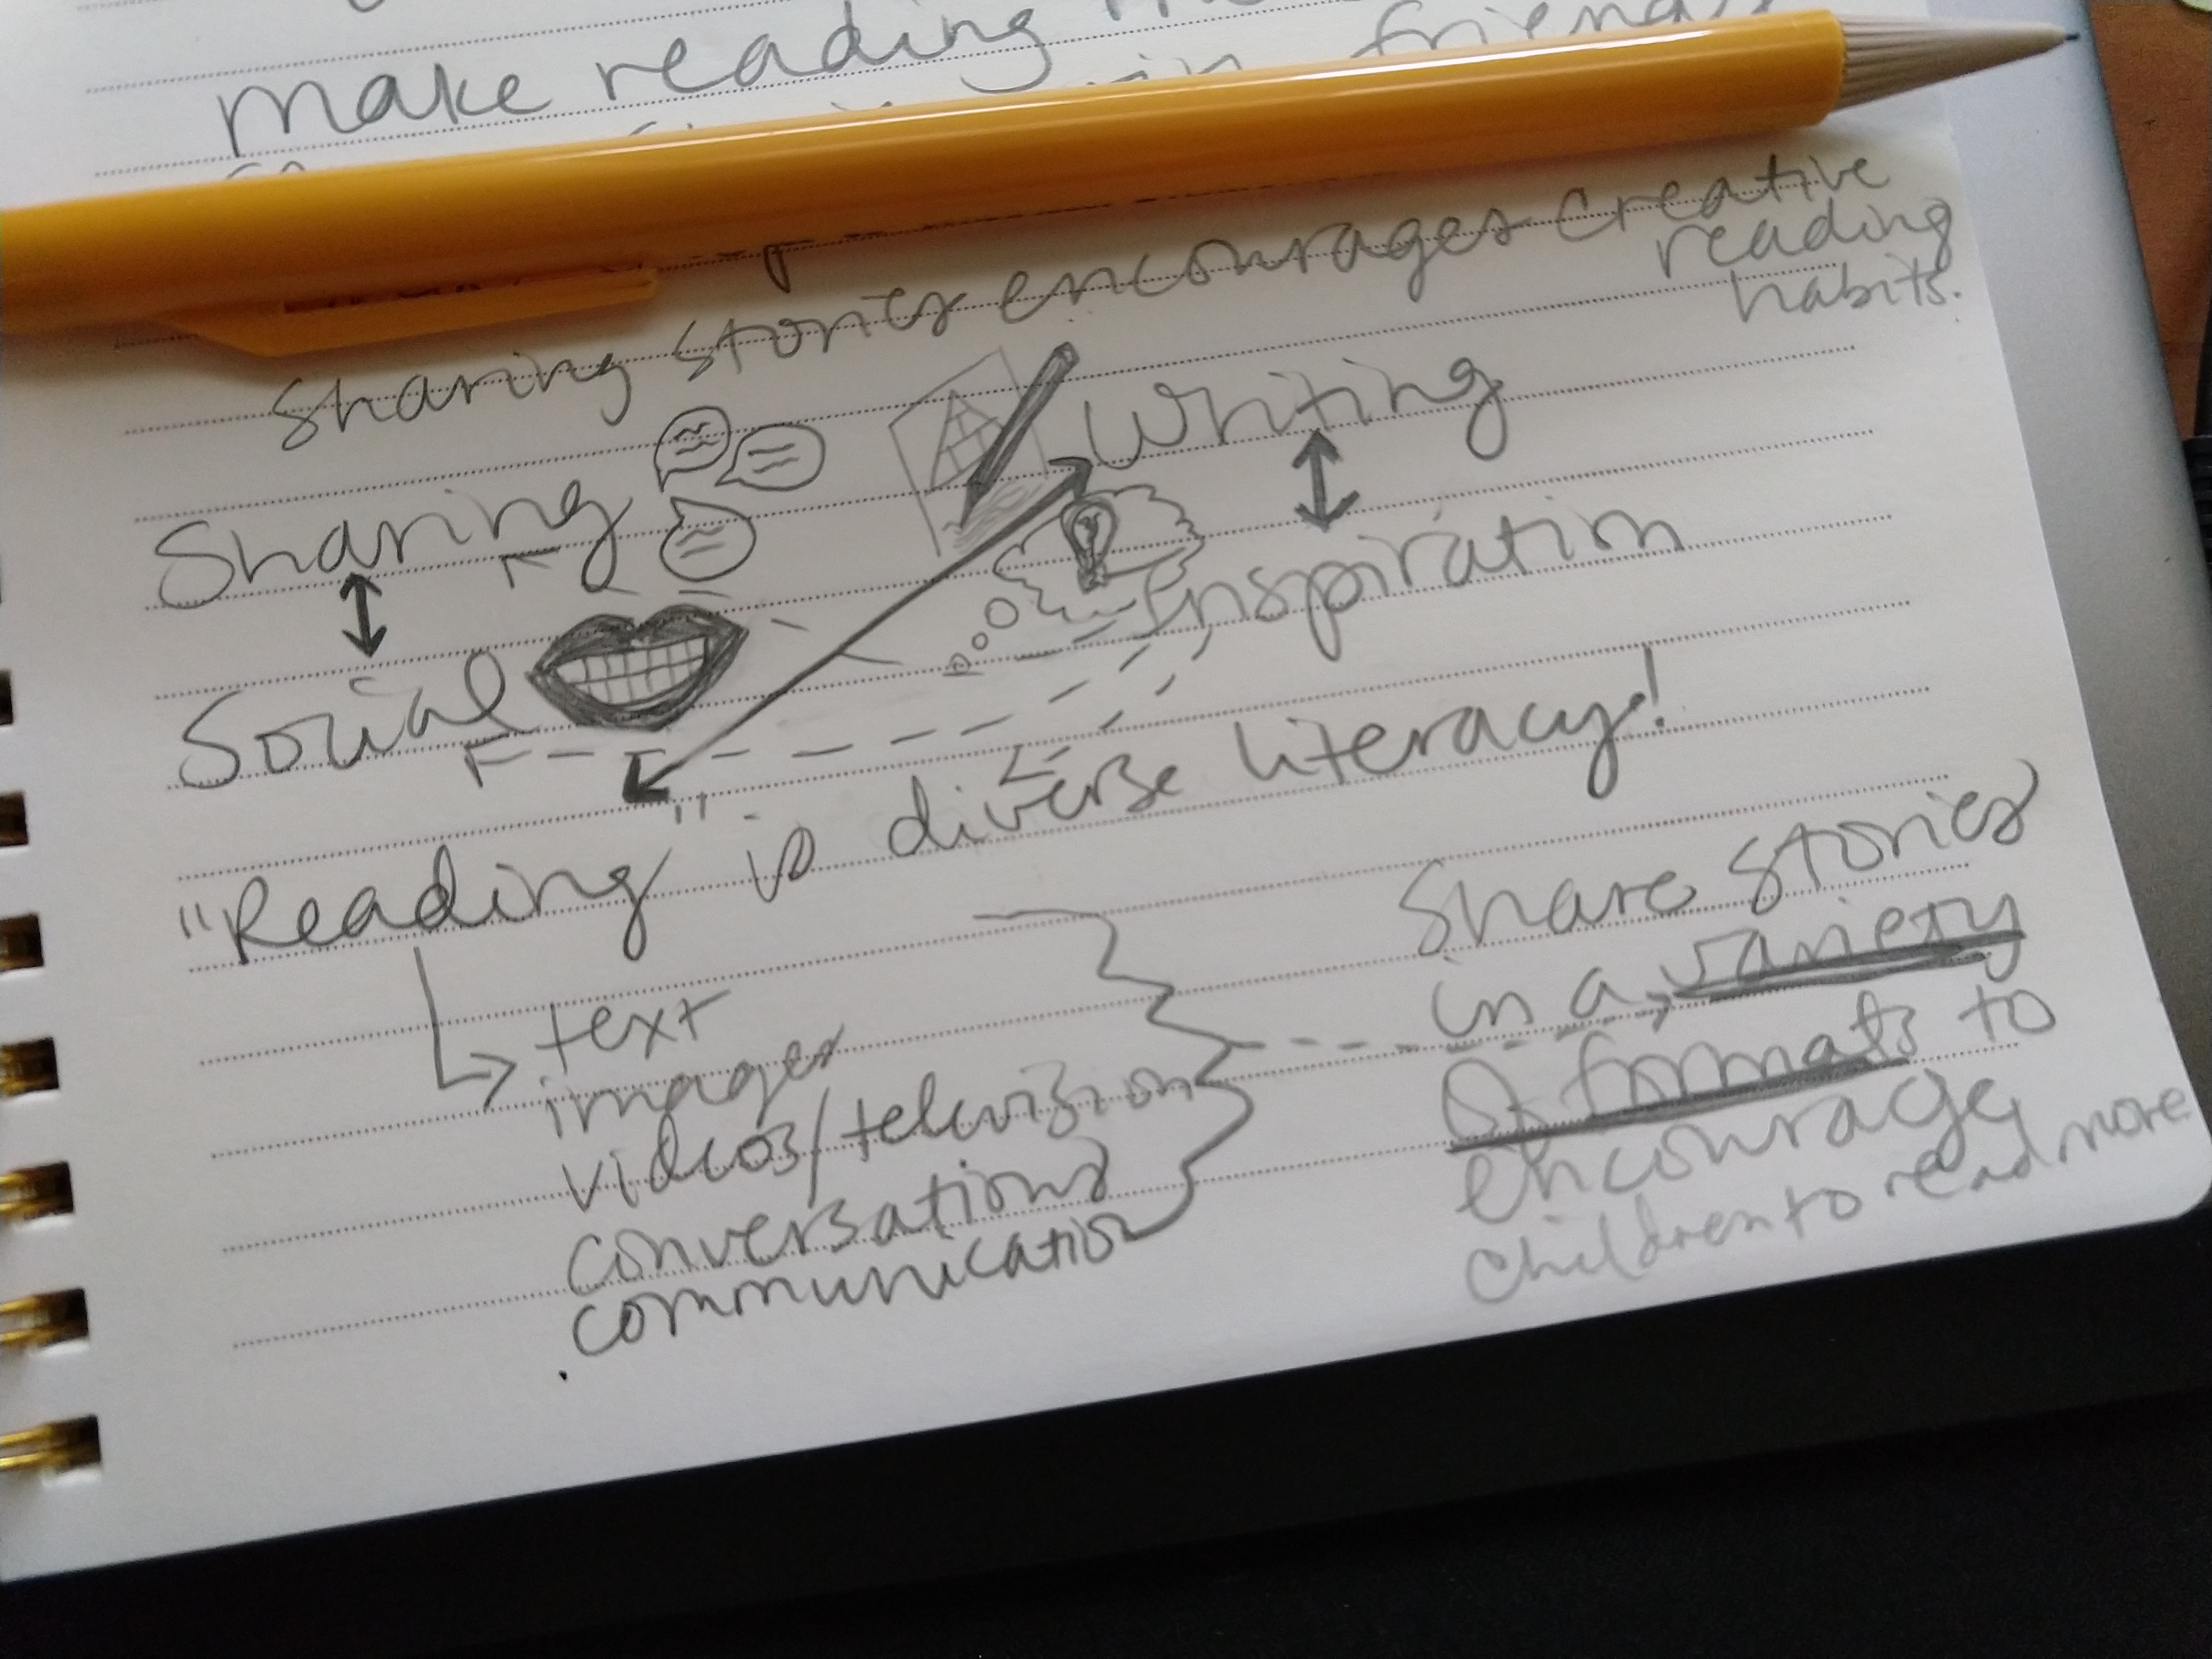
Stakeholder debrief
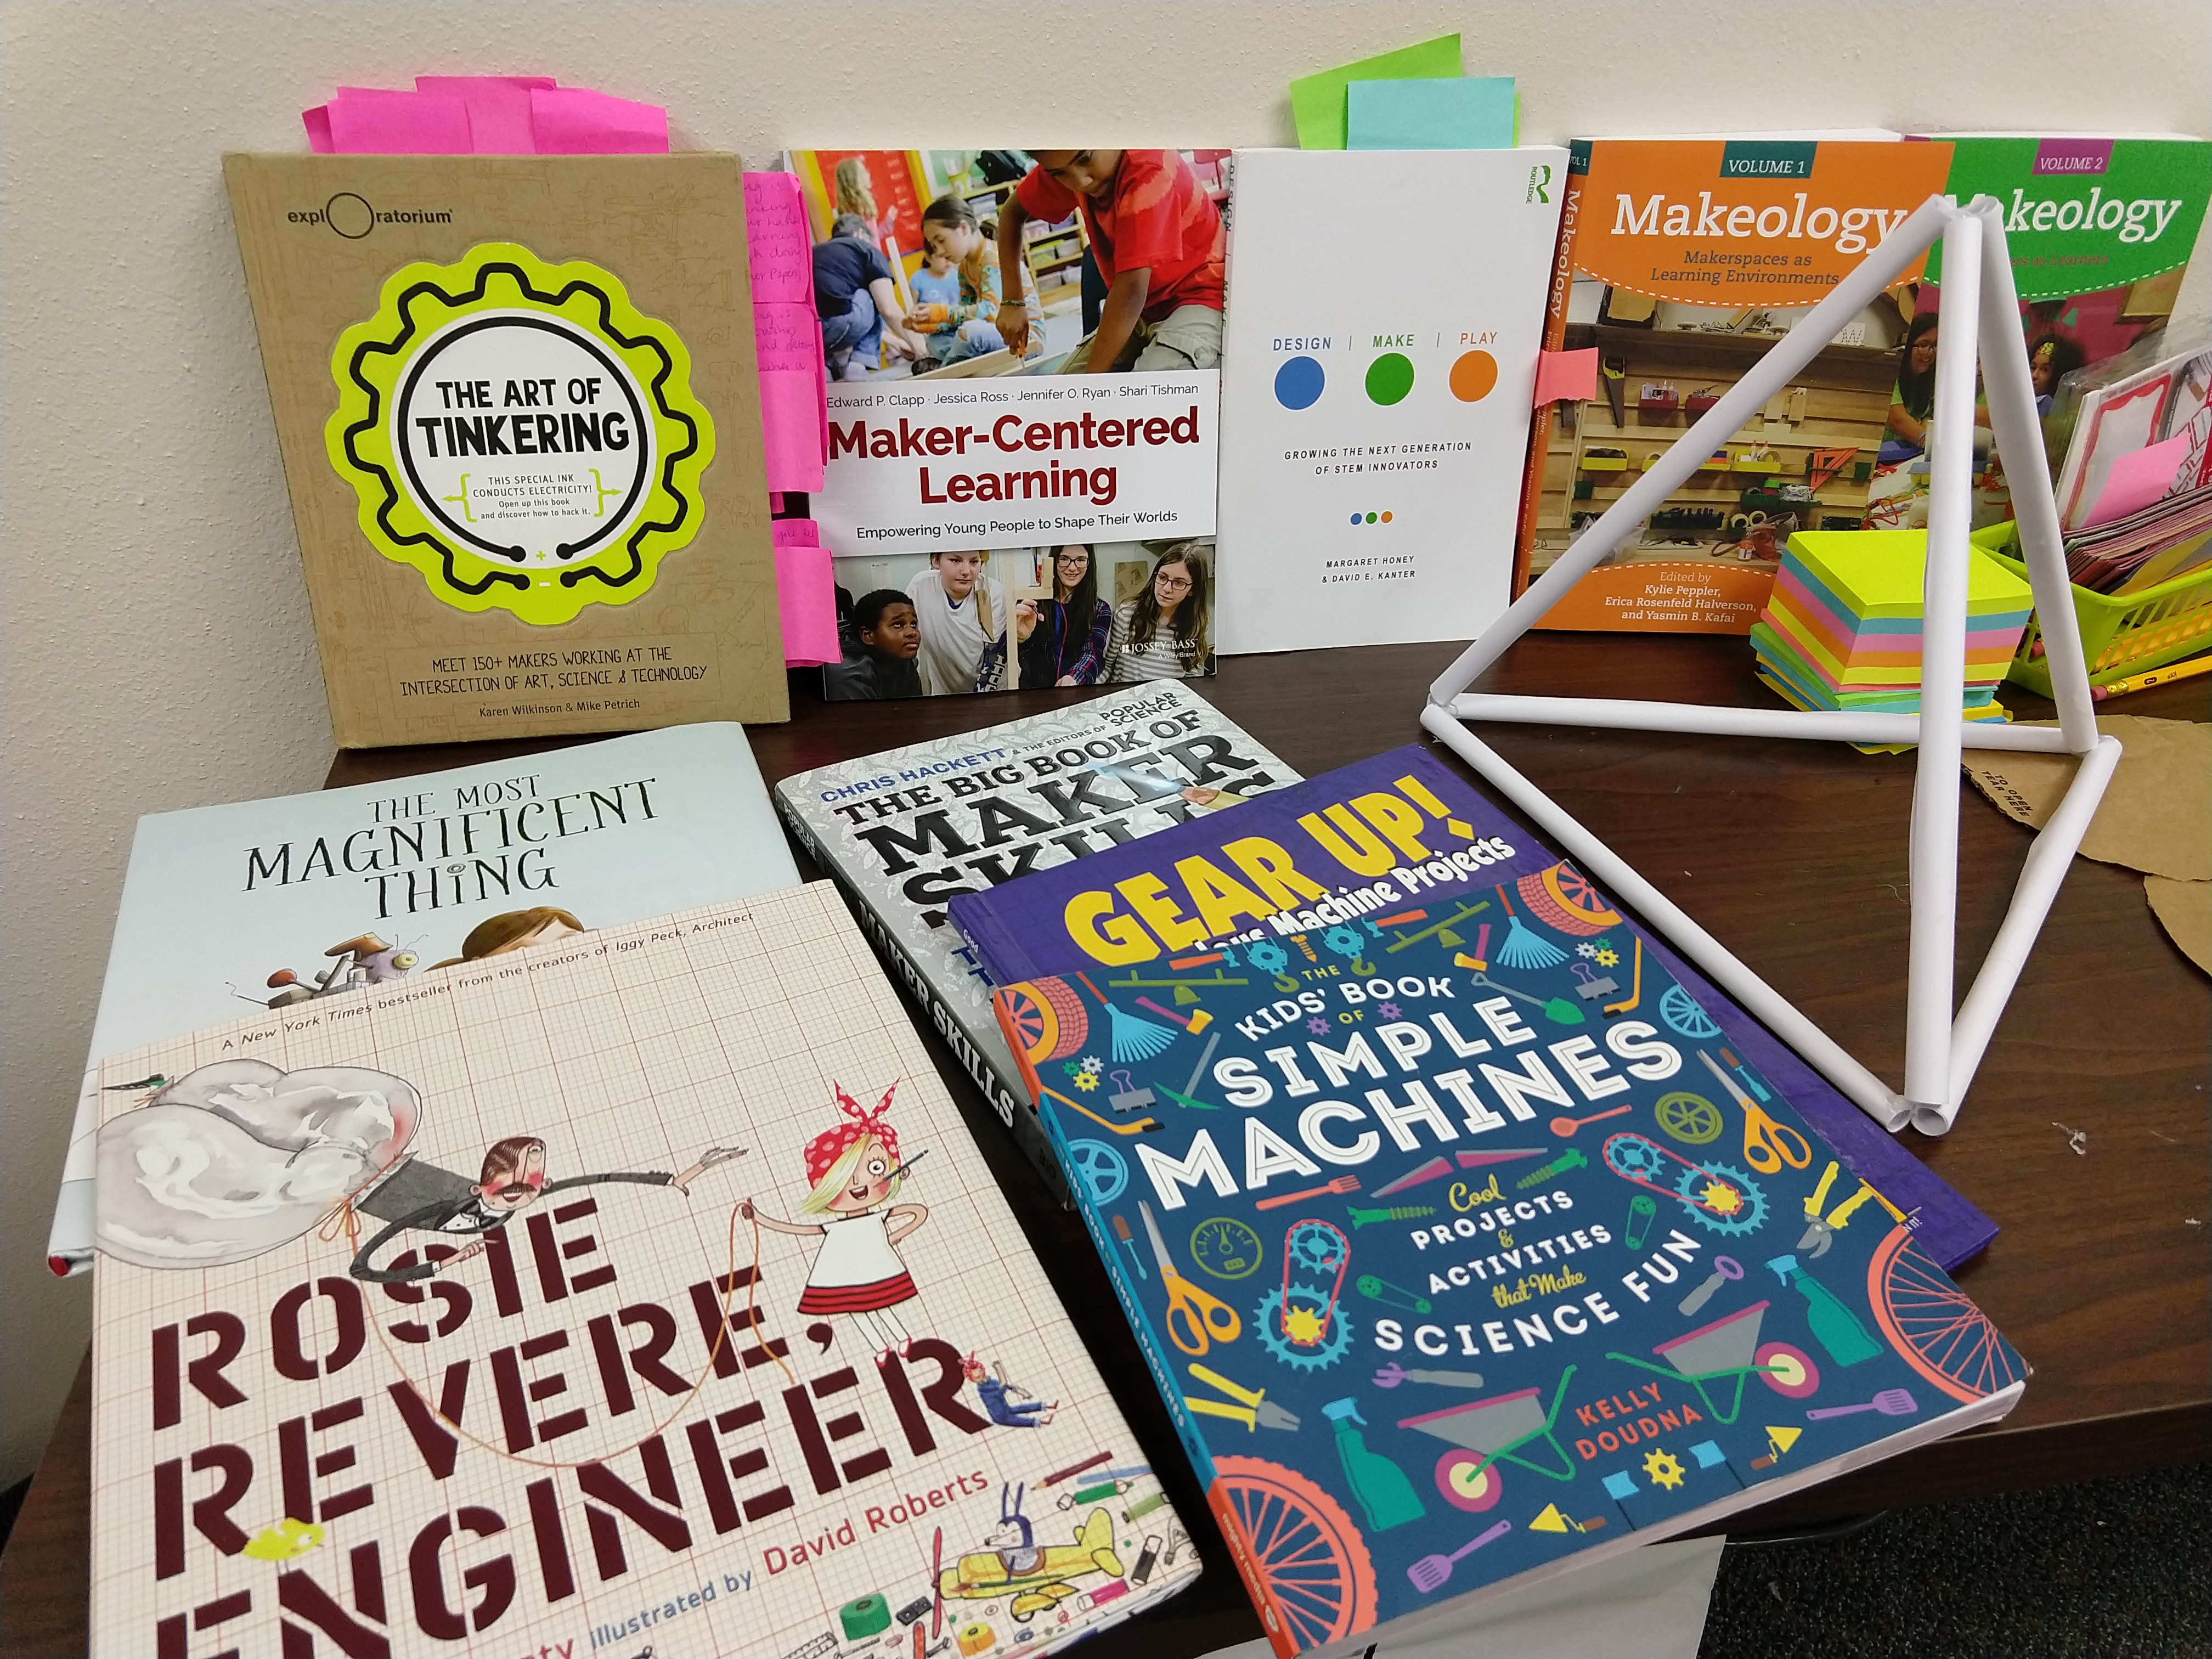
When I debriefed with the librarian we discussed insights about 1) reading is a diverse literacy, and 2) students wanted to share stories in a variety of formats. The librarian mentioned interest in a research-proven activity called Novel Engineering, which involved students designing prototype solutions for problems that characters are experiencing in a novel. The librarian and I collaboratively researched and discovered a variety of example artifacts from students in formal classrooms and informal workshops, which included use of common inexpensive materials (e.g., recyclables, tape, glue, paper clips, string).
Brainstorming with student users
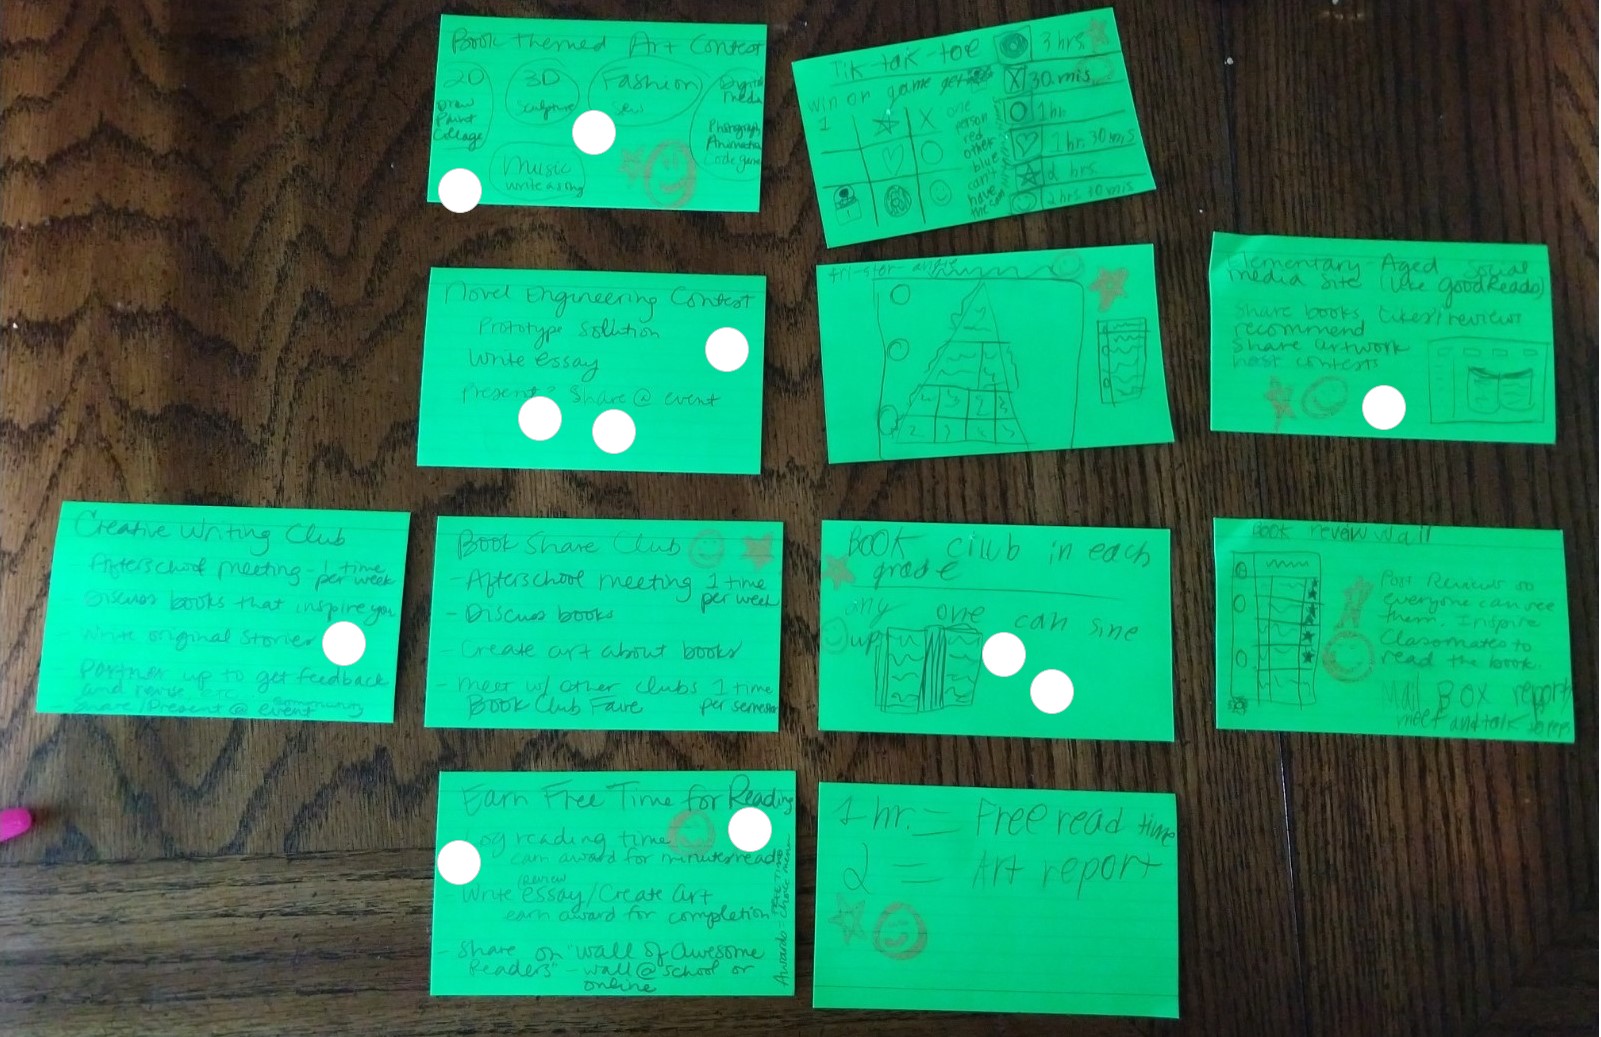
After the debrief, the librarian invited three students to the library for a collaborative brainstorming session, which we facilitated by writing ideas on note cards, dot voting (students got three votes each and adults got one vote), and discussion. As a whole, students expressed an interest in doing more than just taking a reading comprehension test about the books they read…they wanted to demonstrate their reading comprehension in more creative ways, including creating objects inspired by books and having clubs to discuss shared interests in reading and writing. We discussed the ideas that received two votes, including “Book Themed Art Contest”, “Earn Free Time for Reading”, and “Book Club in Each Grade”. While the students liked the idea of “Earn Free Time for Reading” and “Book Club in Each Grade”, two students mentioned that their classroom teachers had something like that for their class and that maybe the librarian could suggest those ideas to all teachers so they could implement them. Students agreed that “Book Themed Art Contest” was similar to the “Novel Engineering Contest” idea, which received three votes. The librarian liked both ideas and agreed that they were both valuable but suggested one idea should be chosen to try out first. The group agreed to start with “Novel Engineering Contest”.
Pilot testing with students
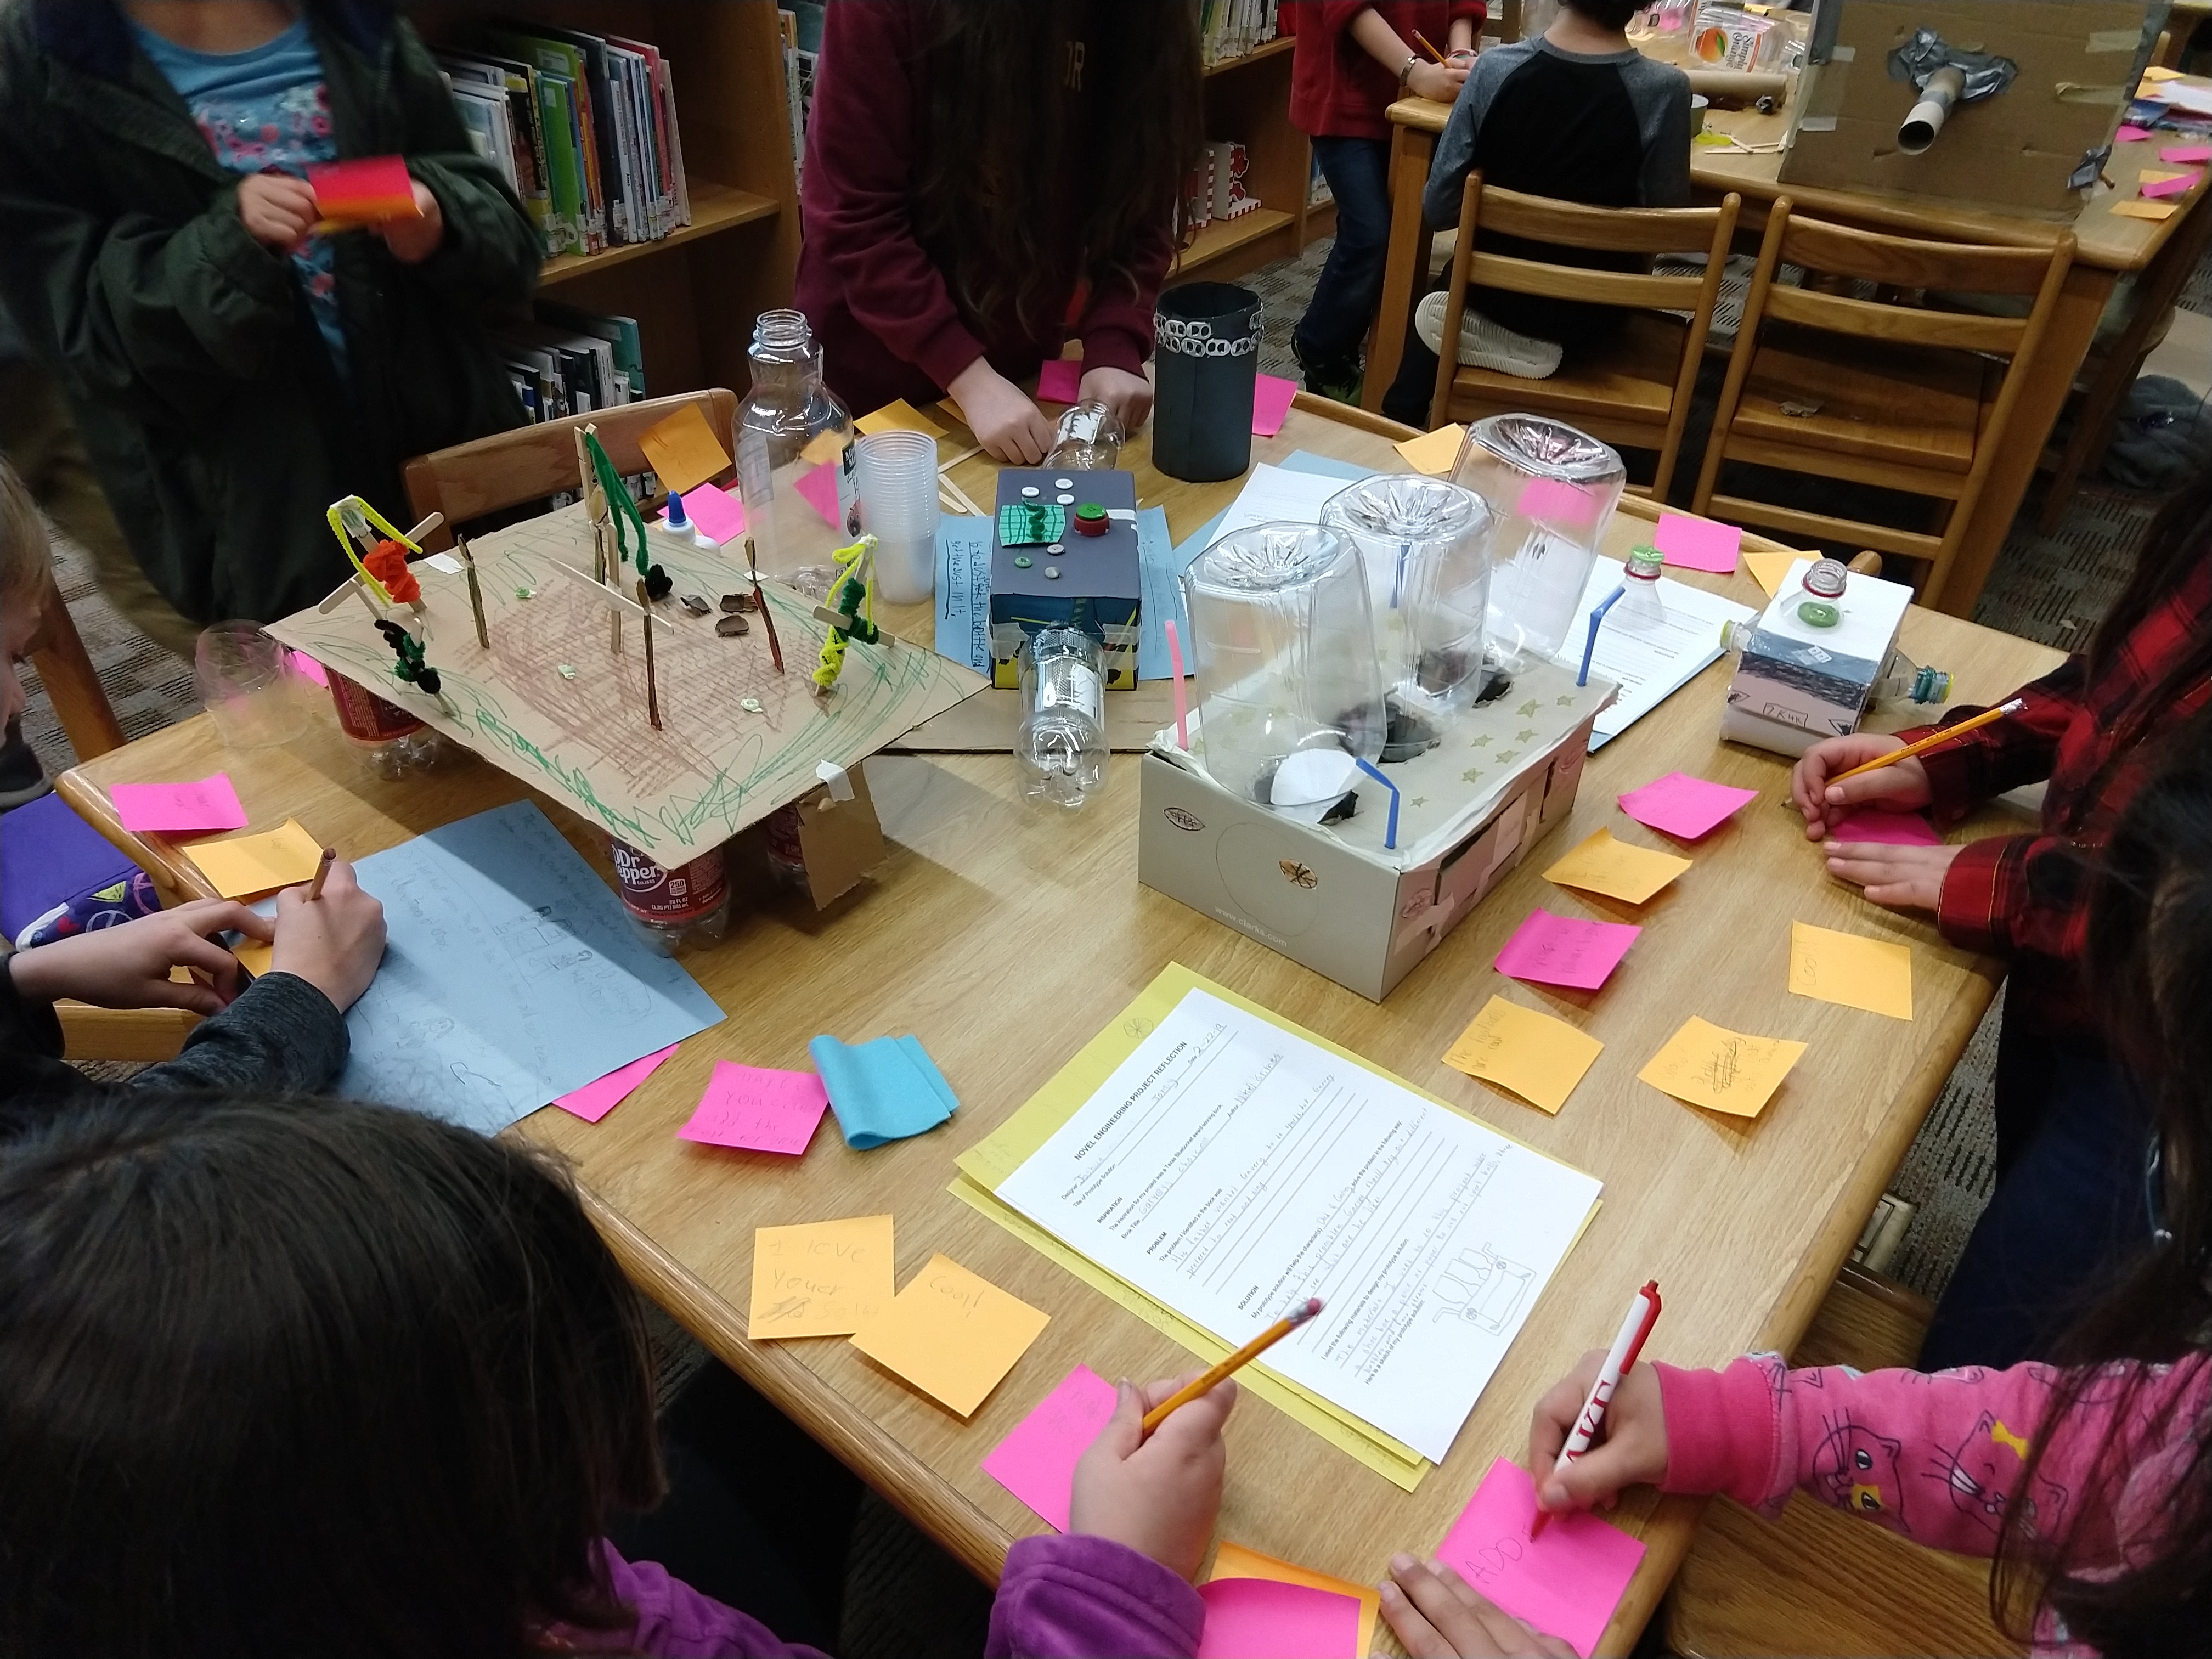
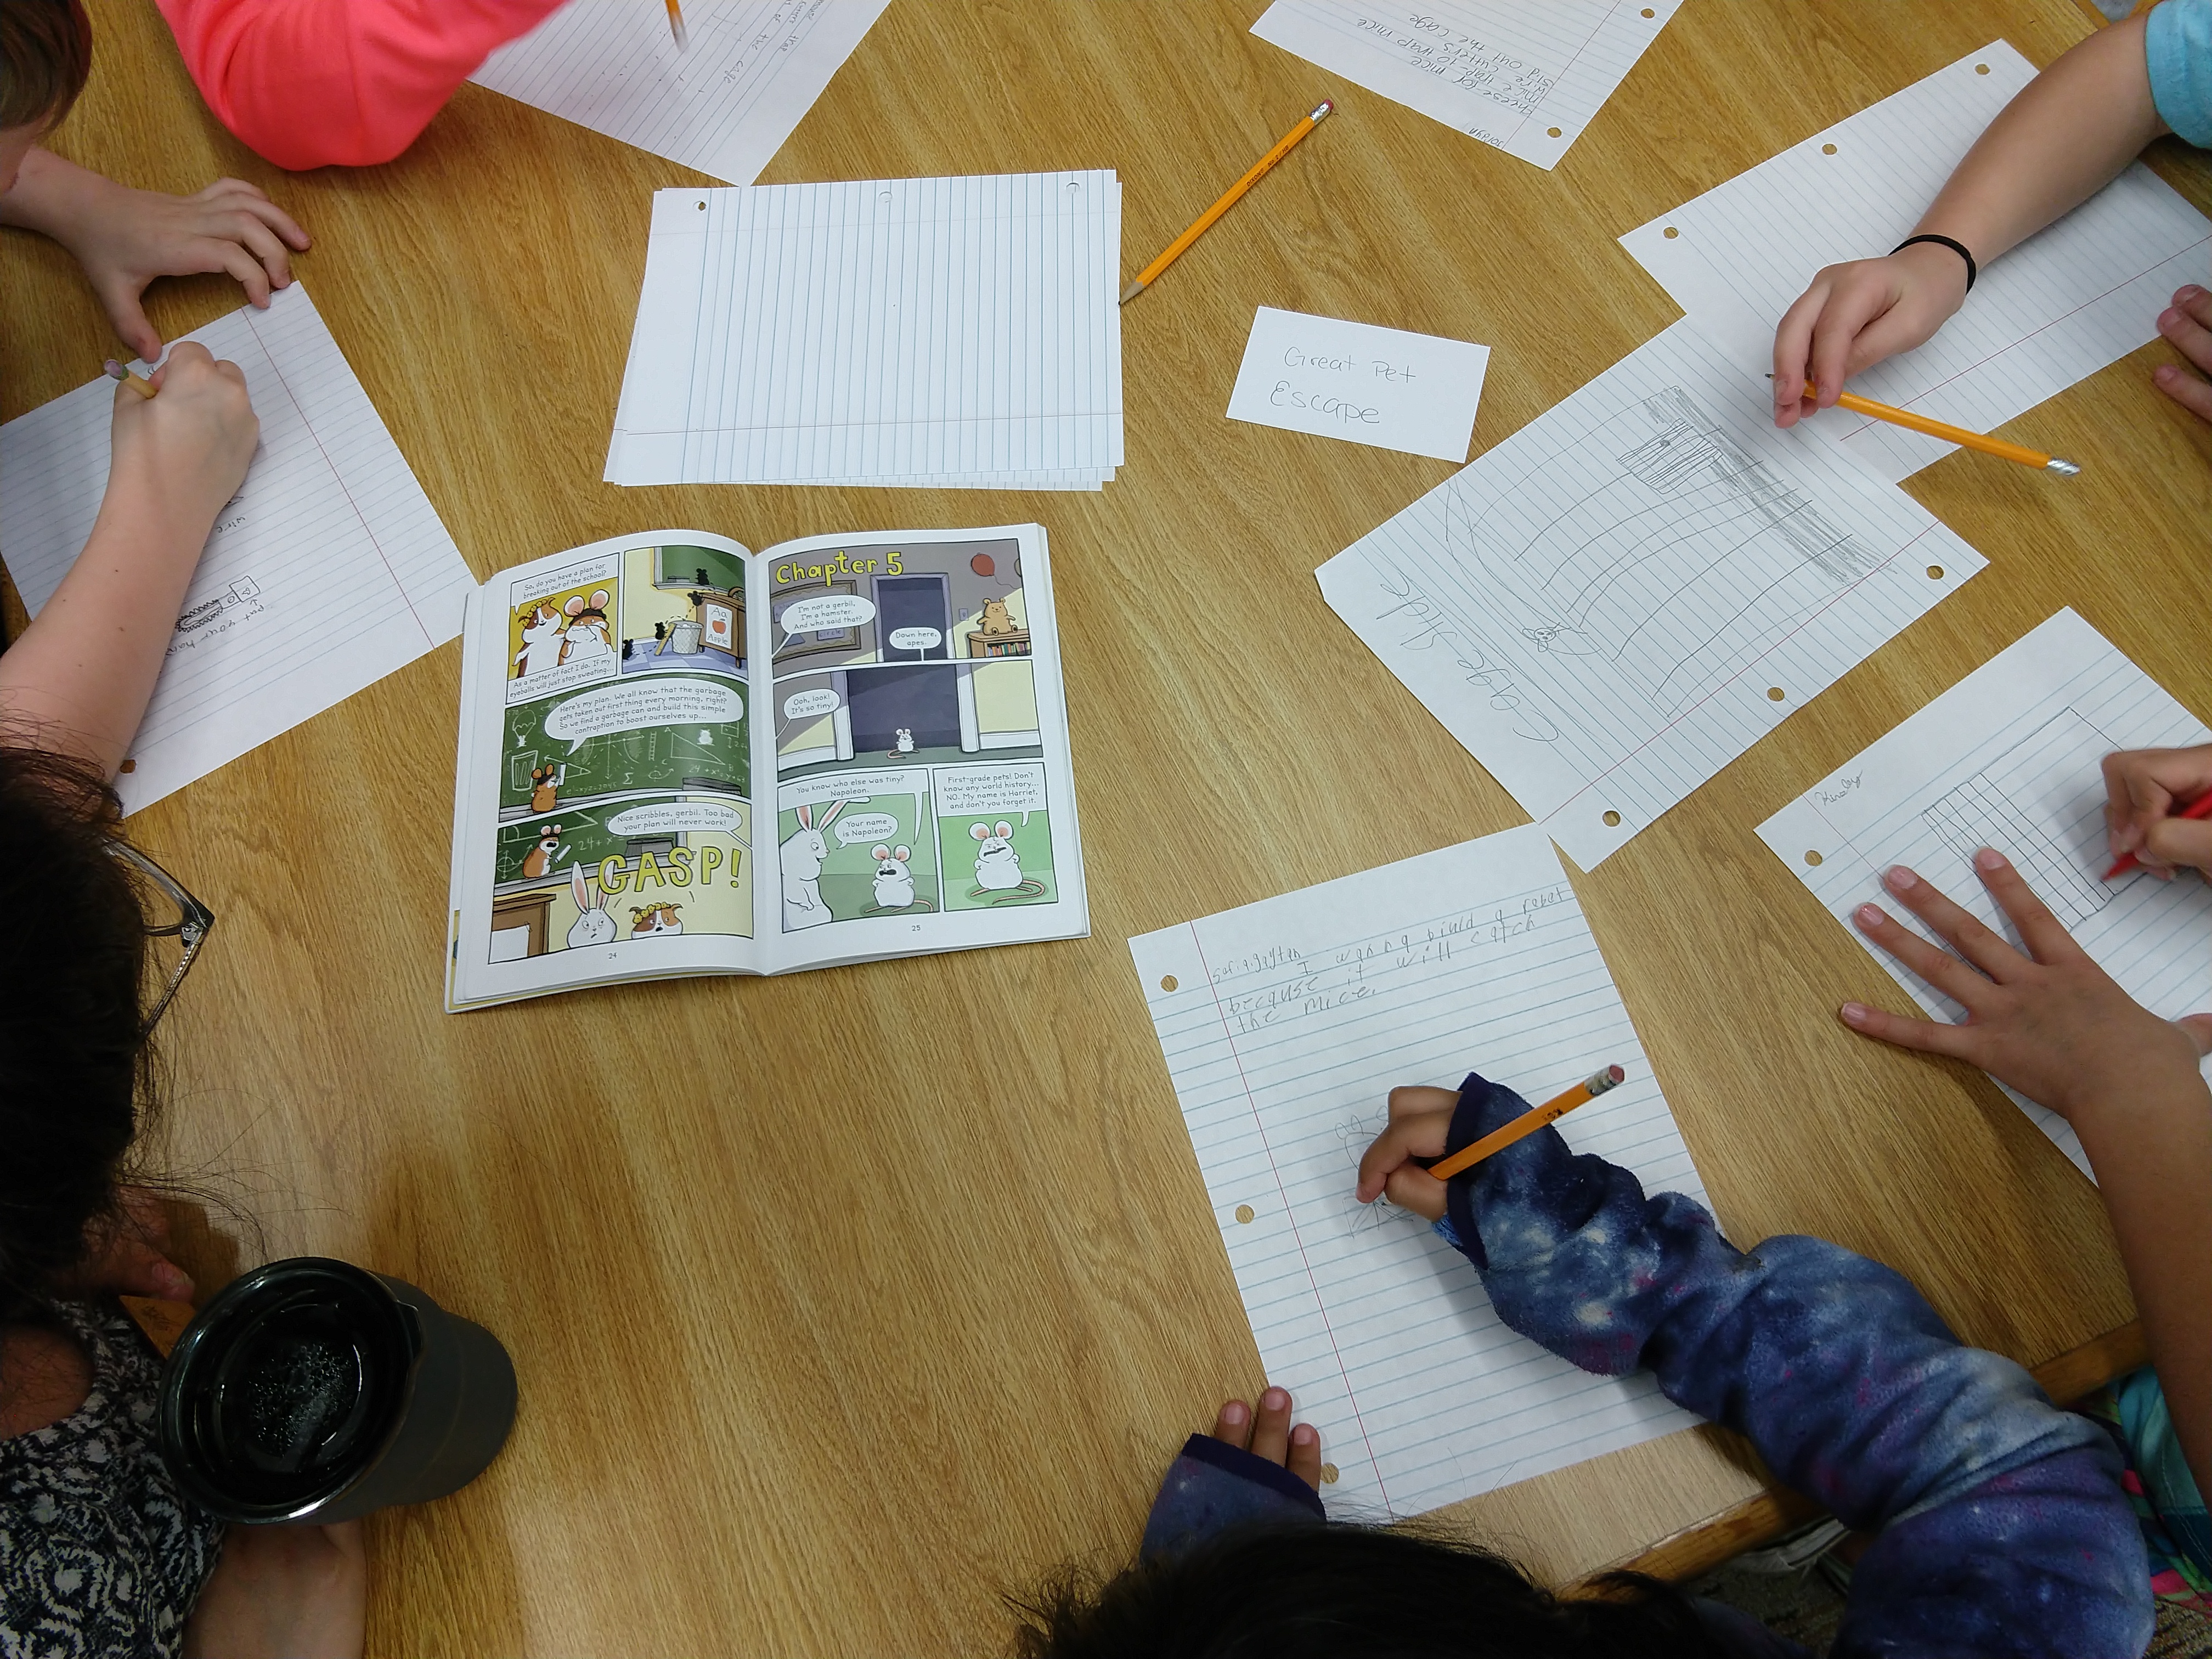
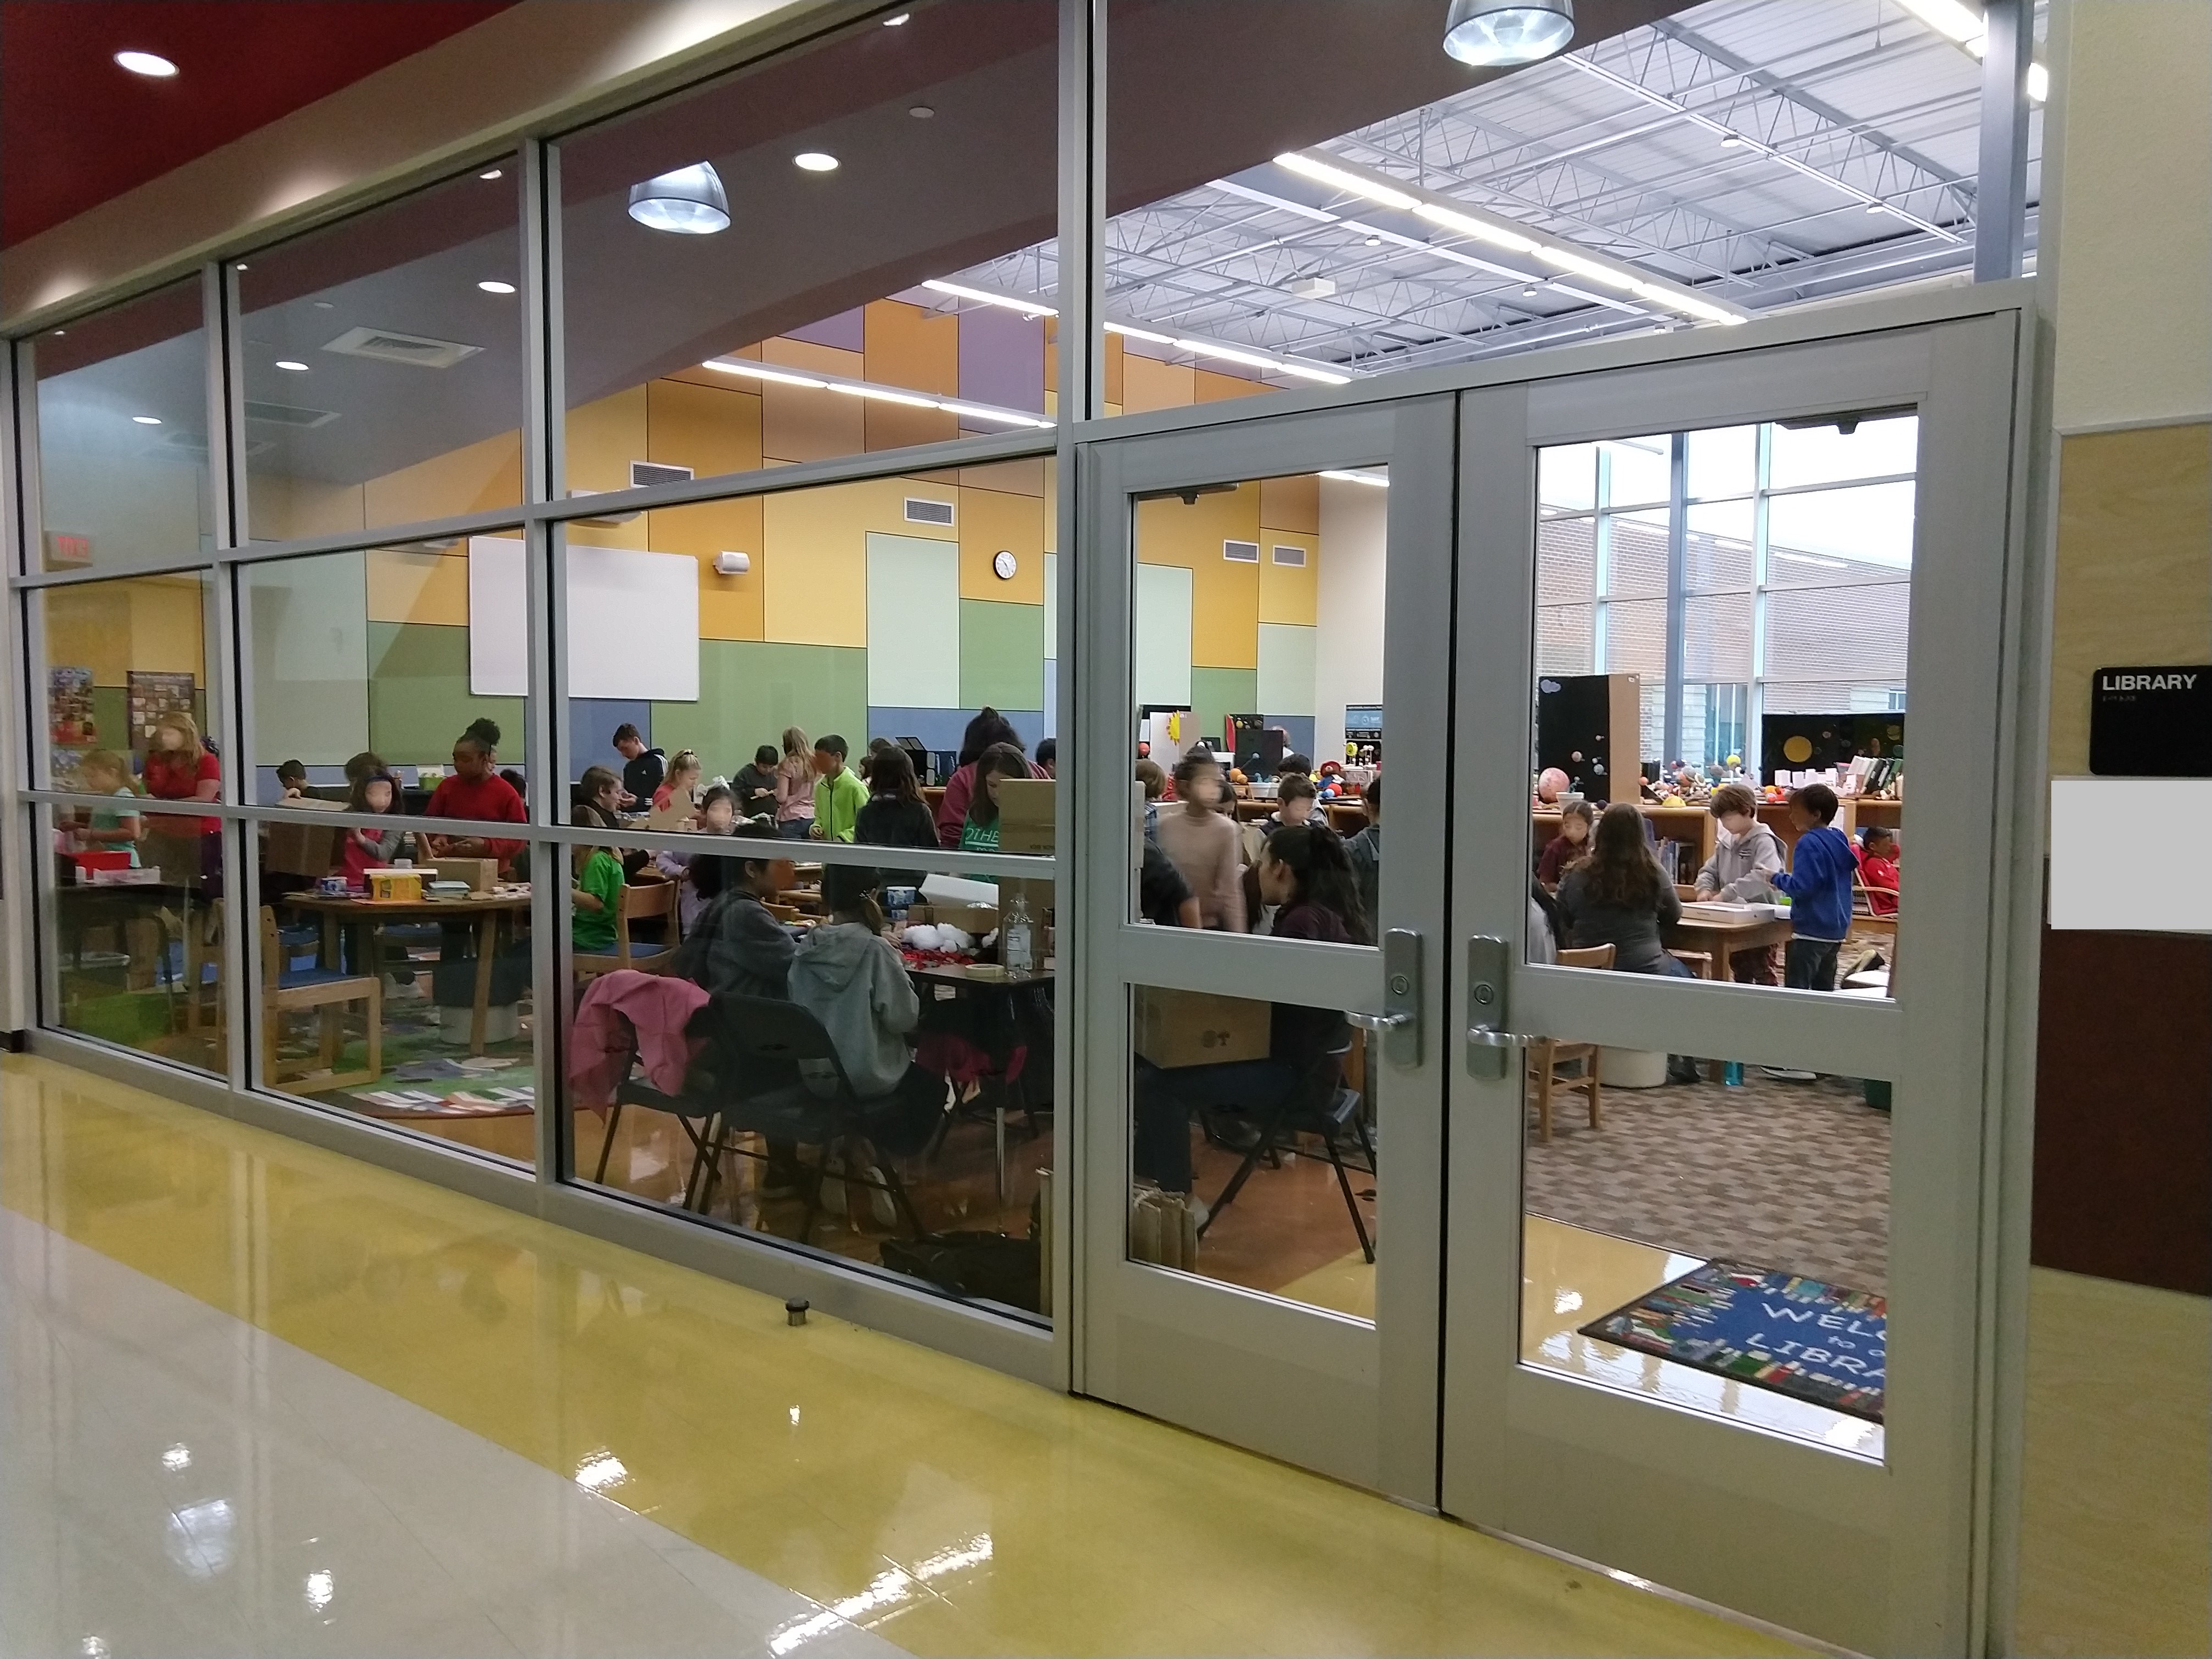
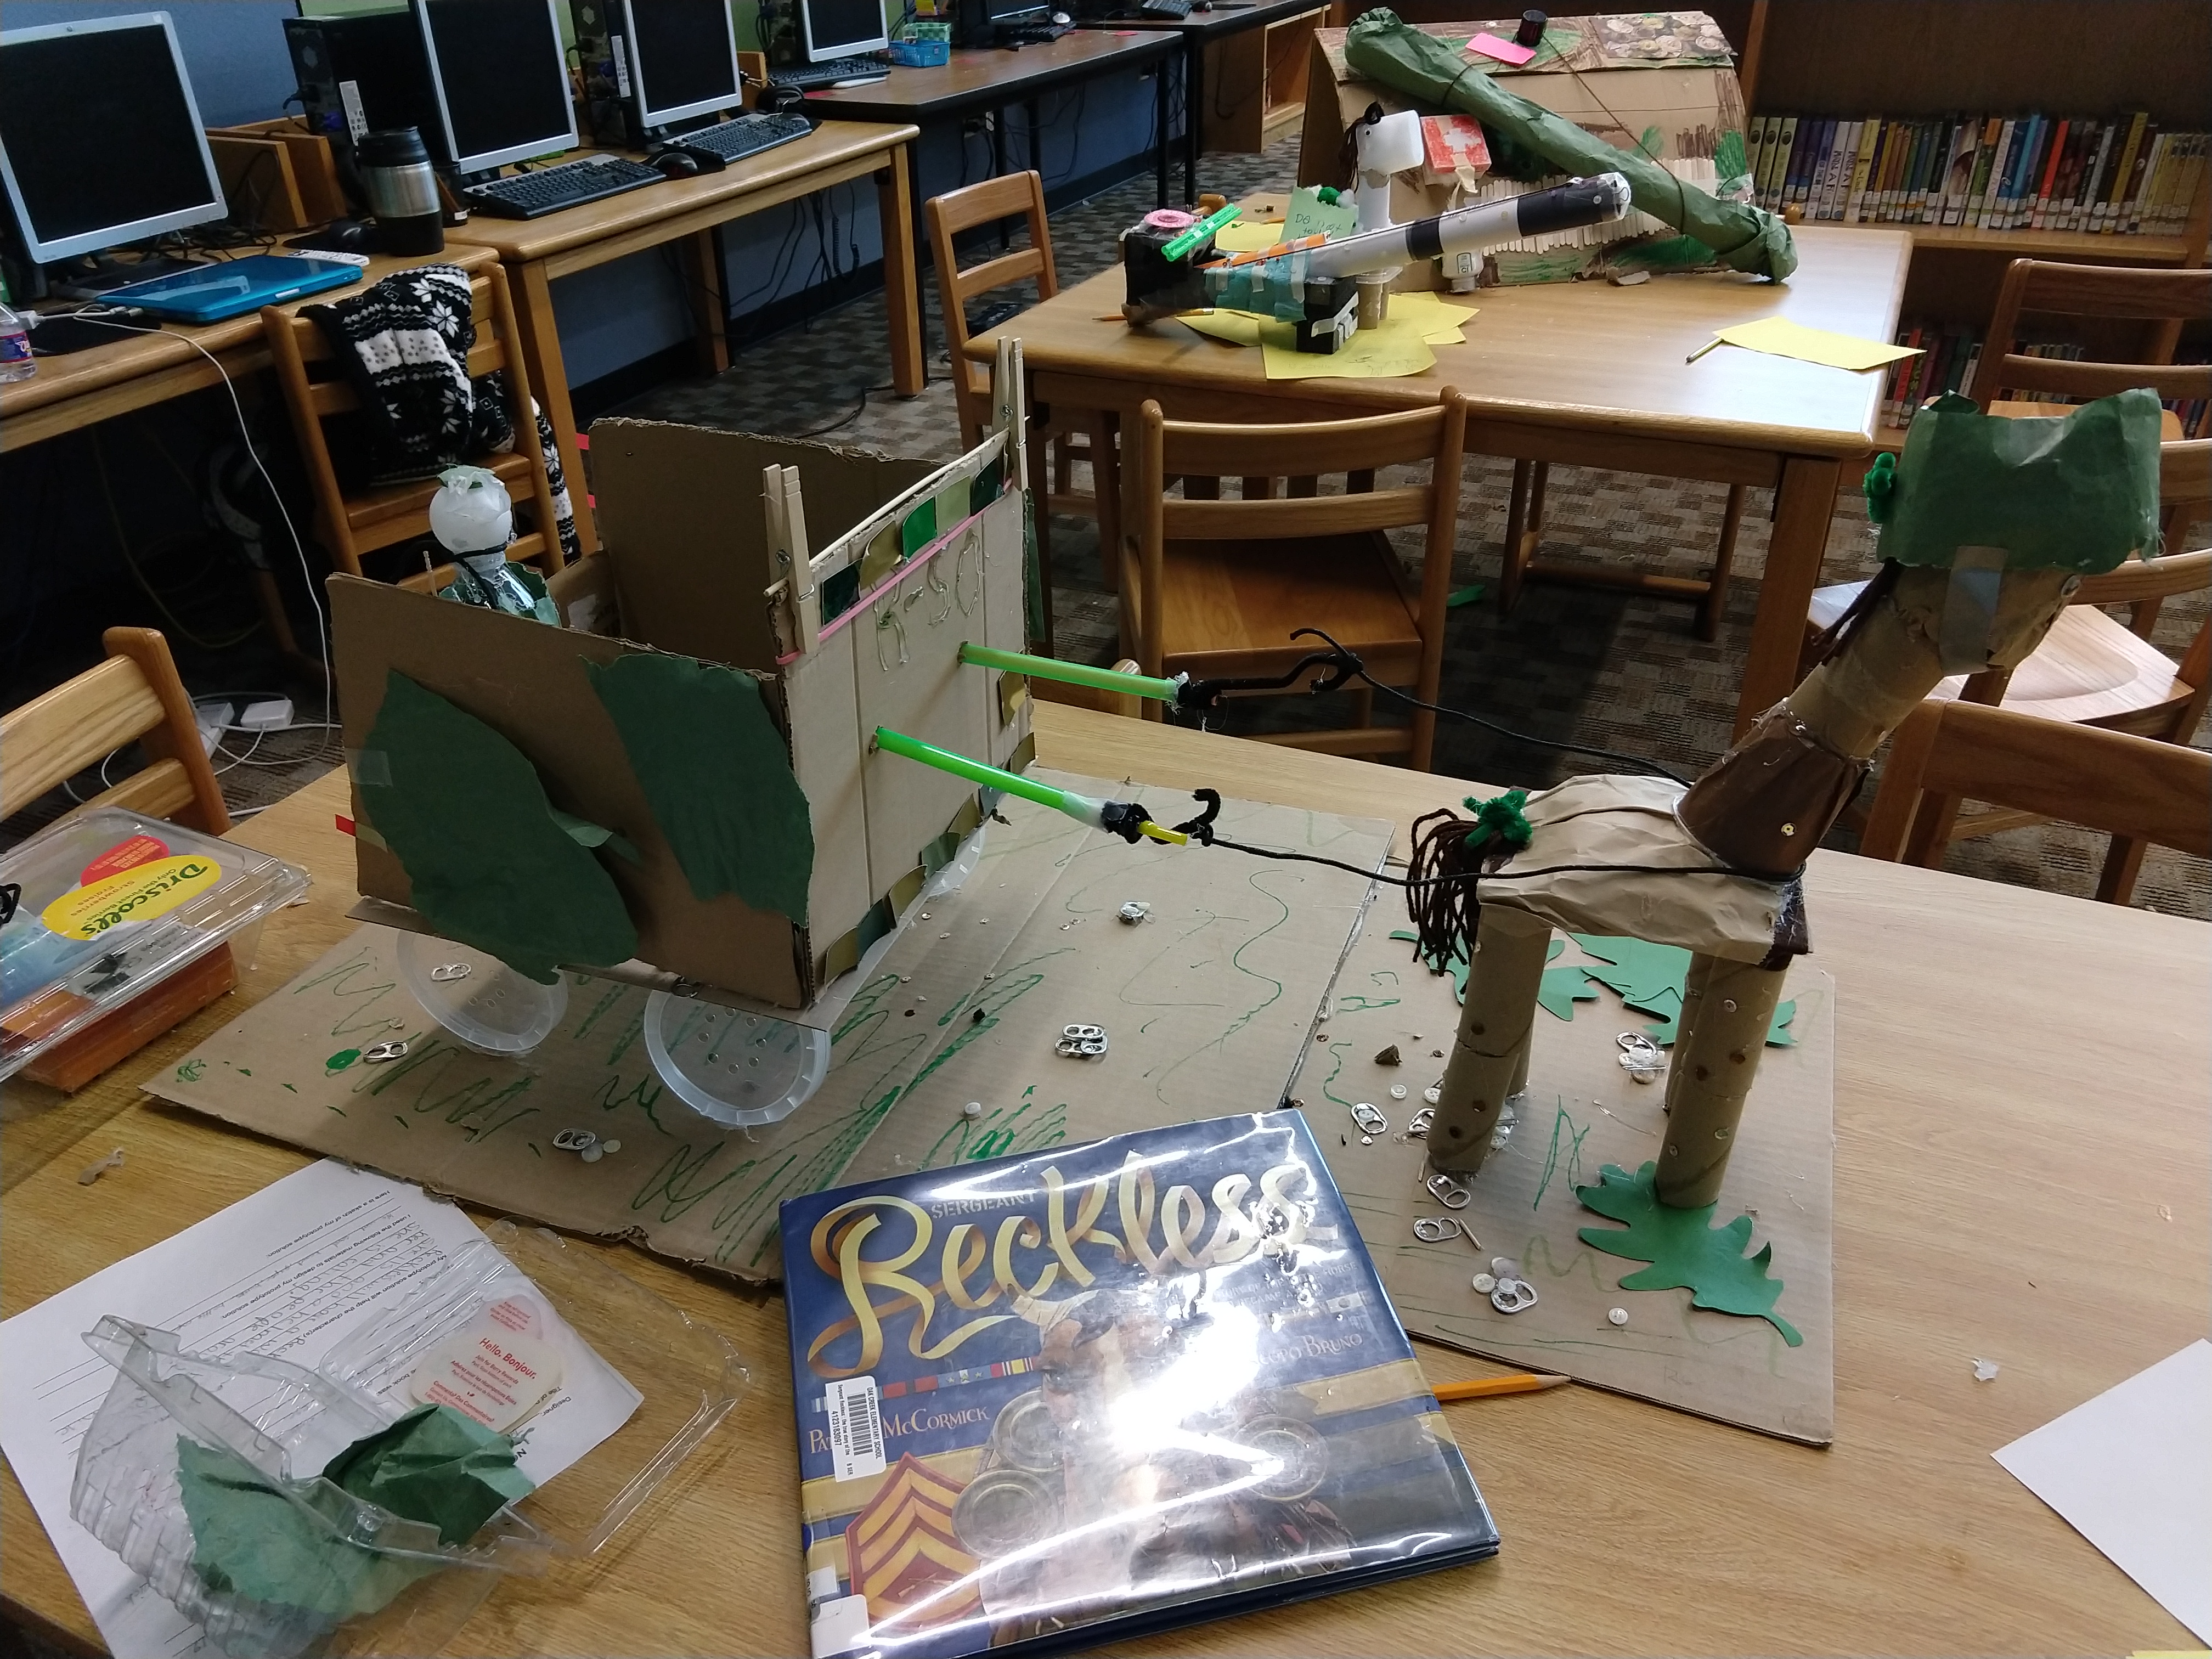
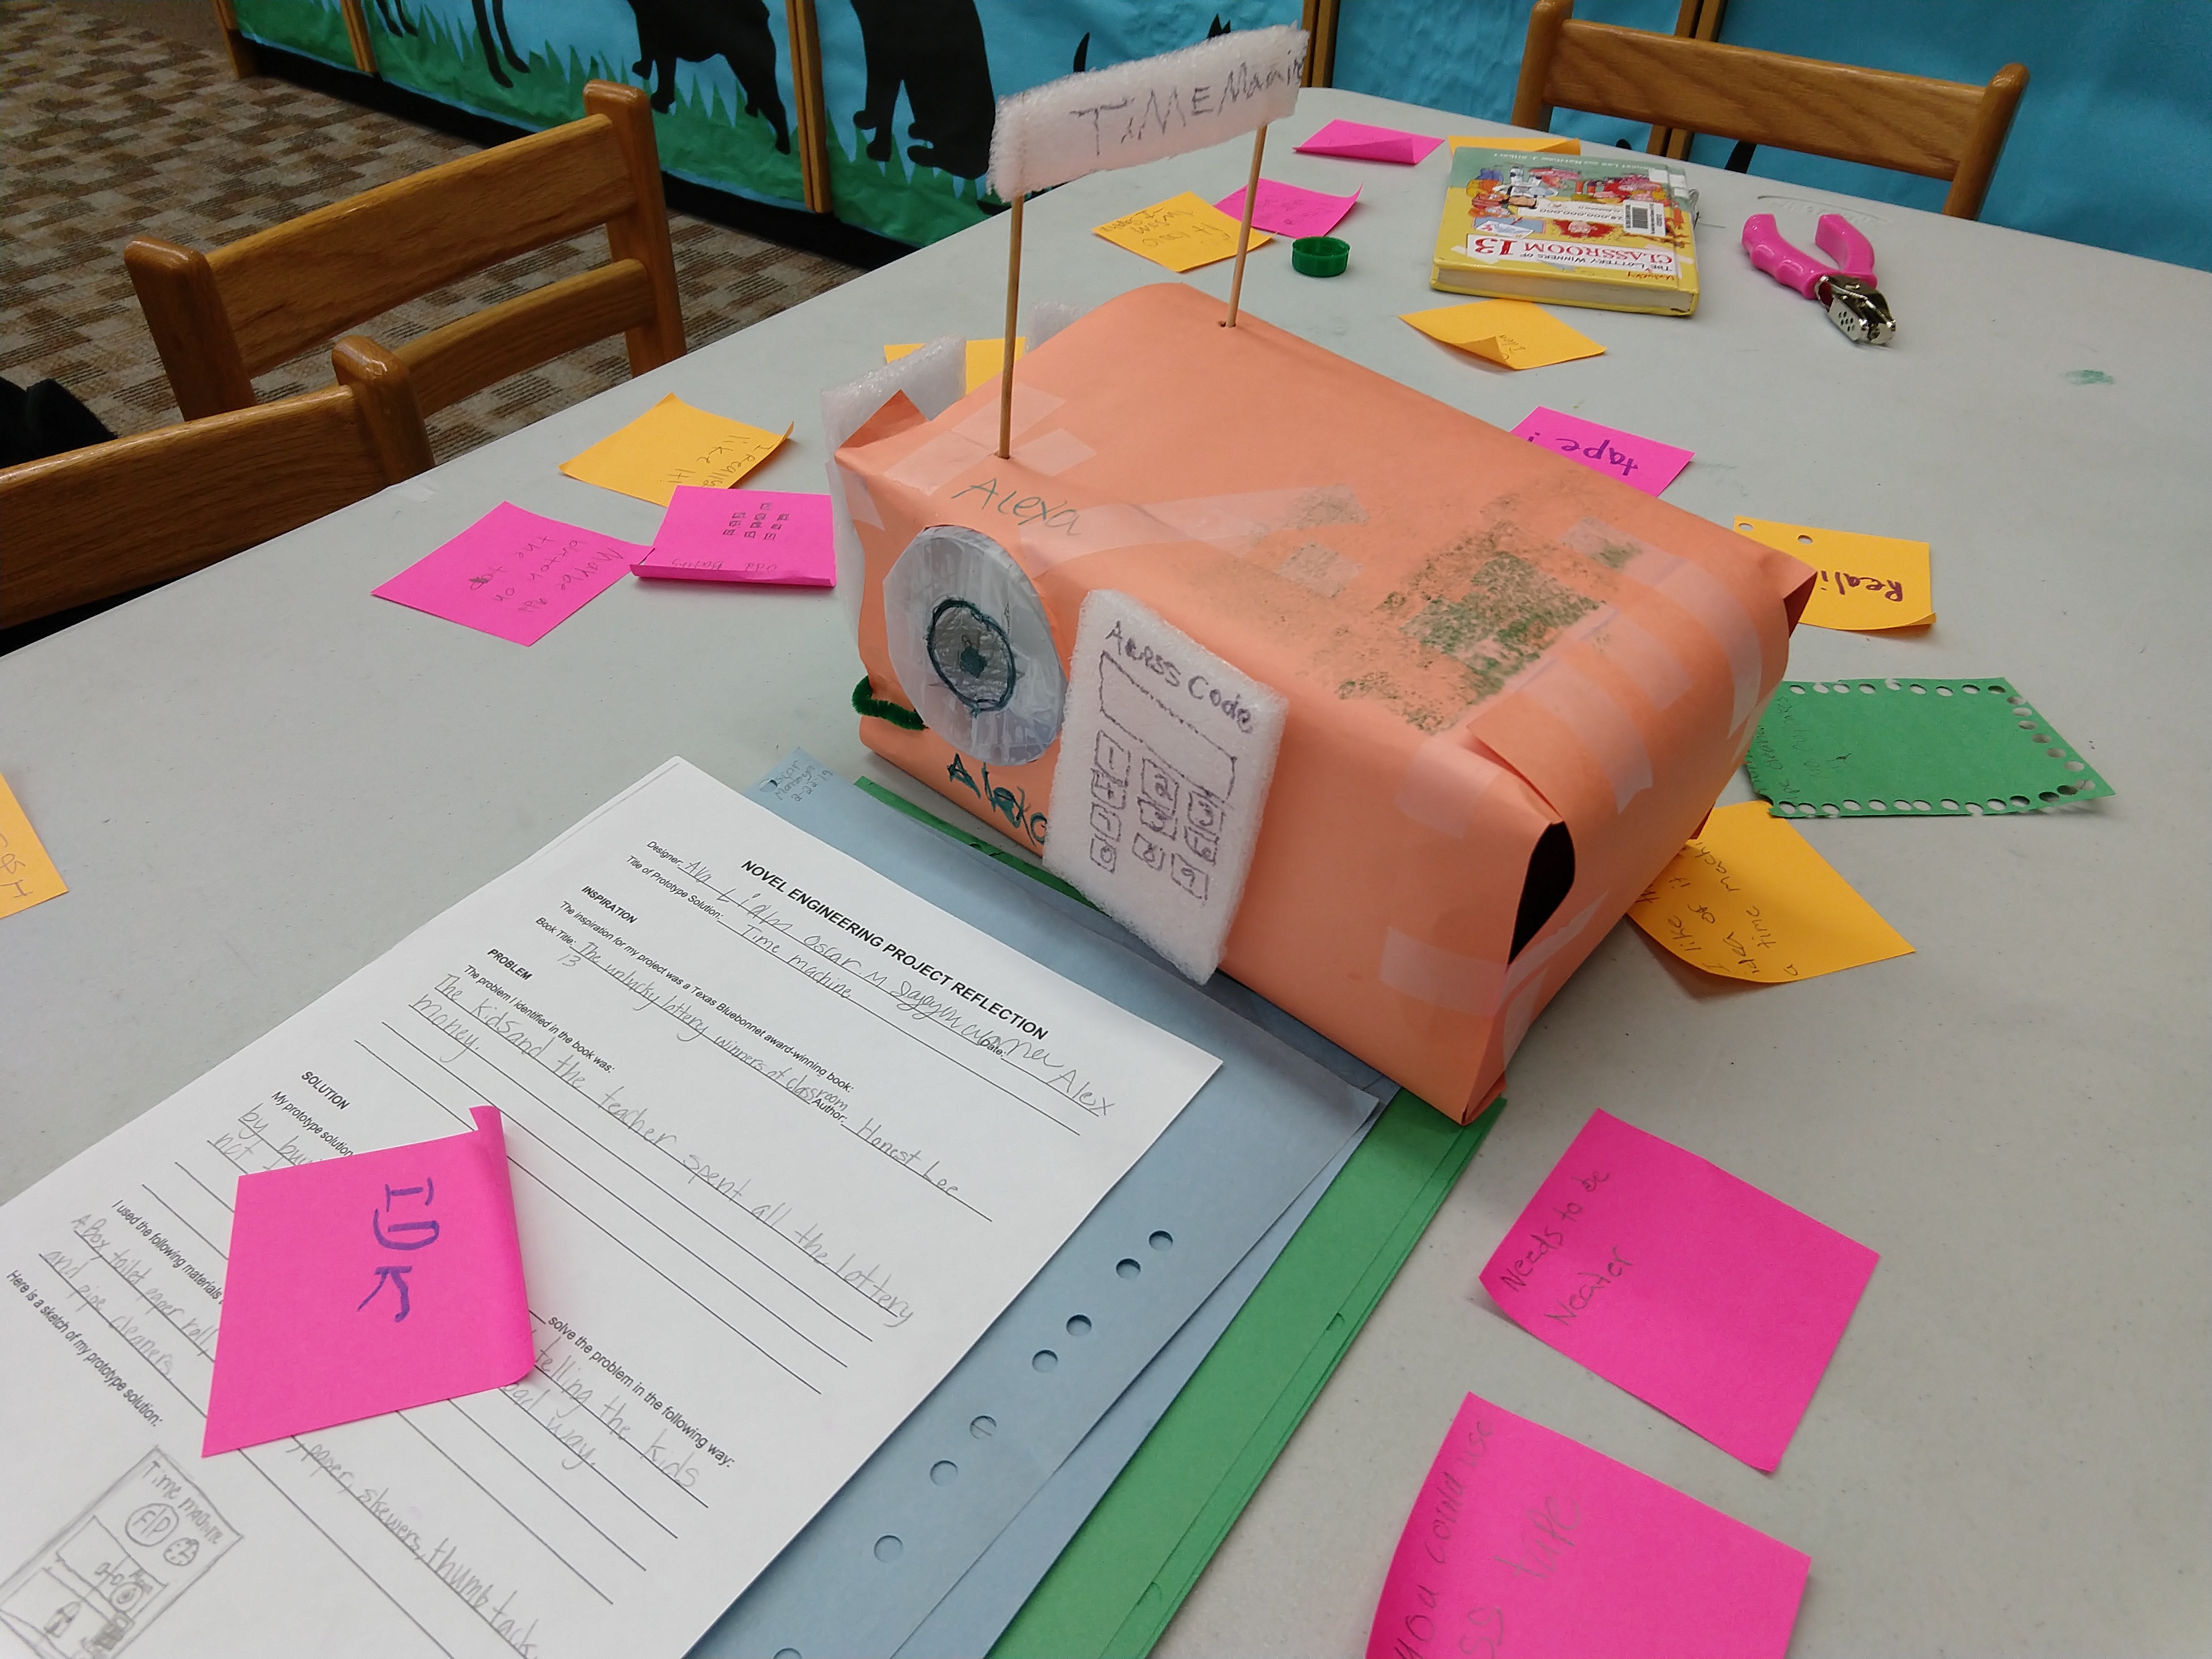
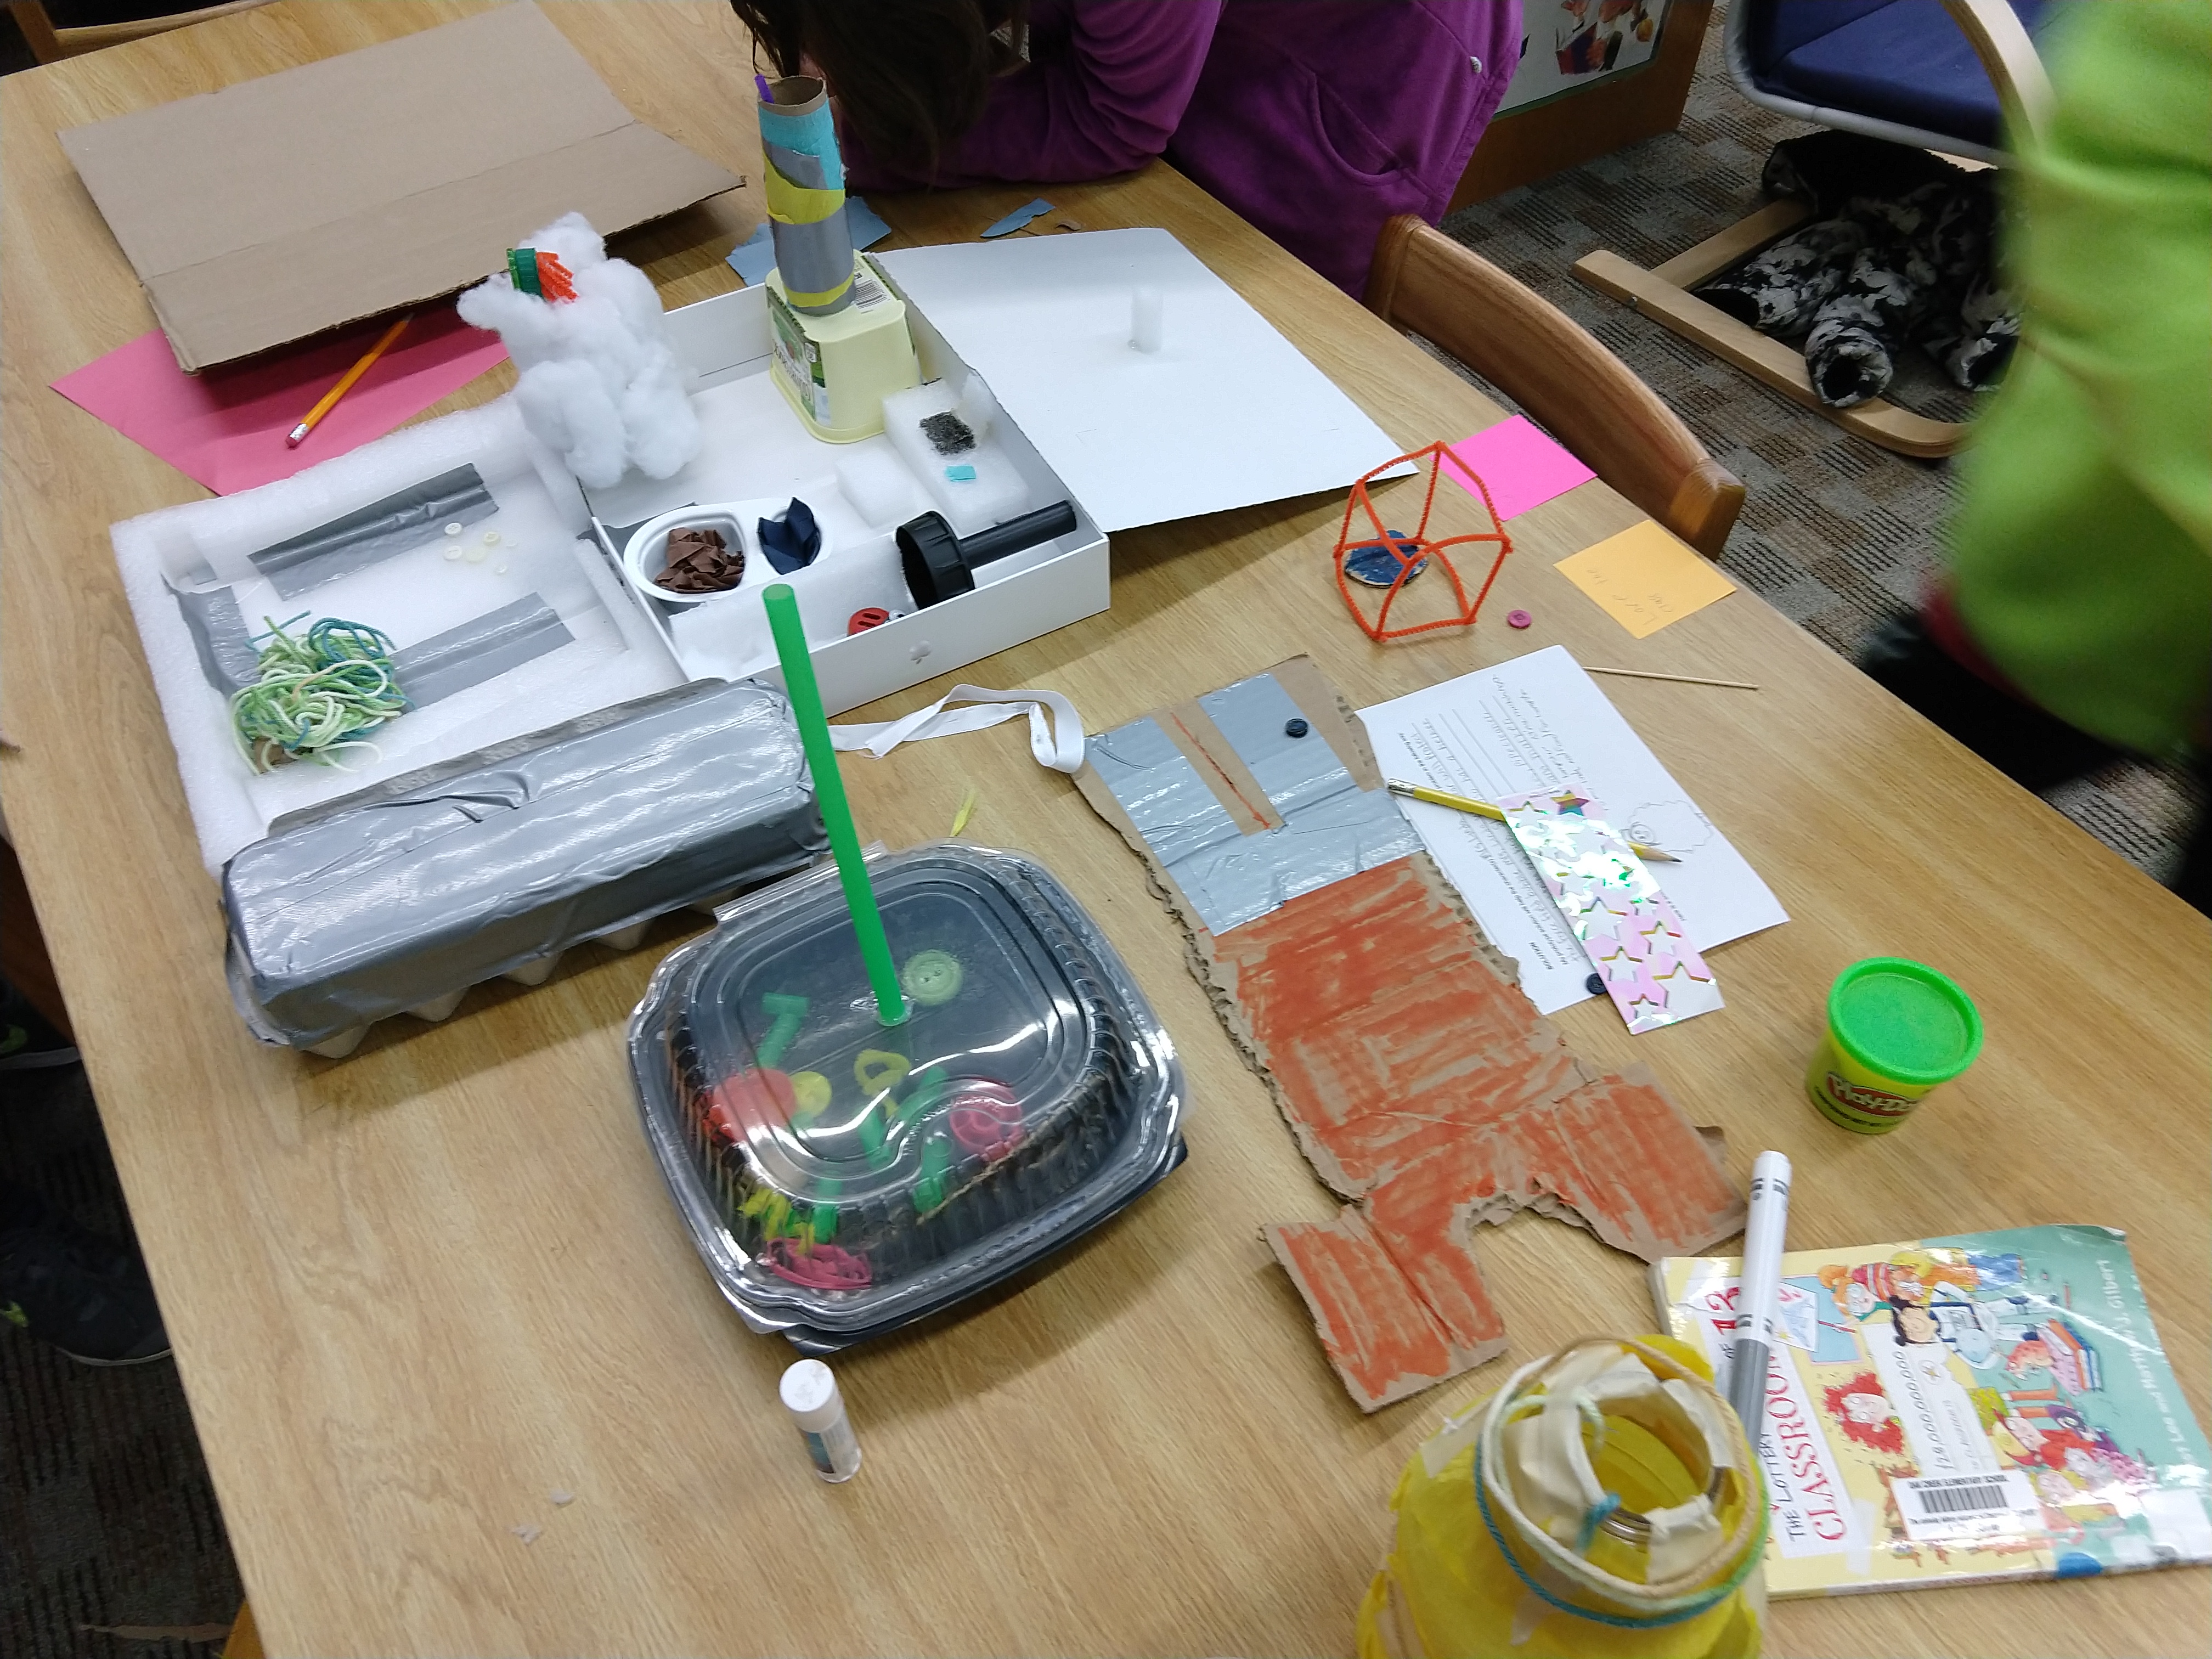
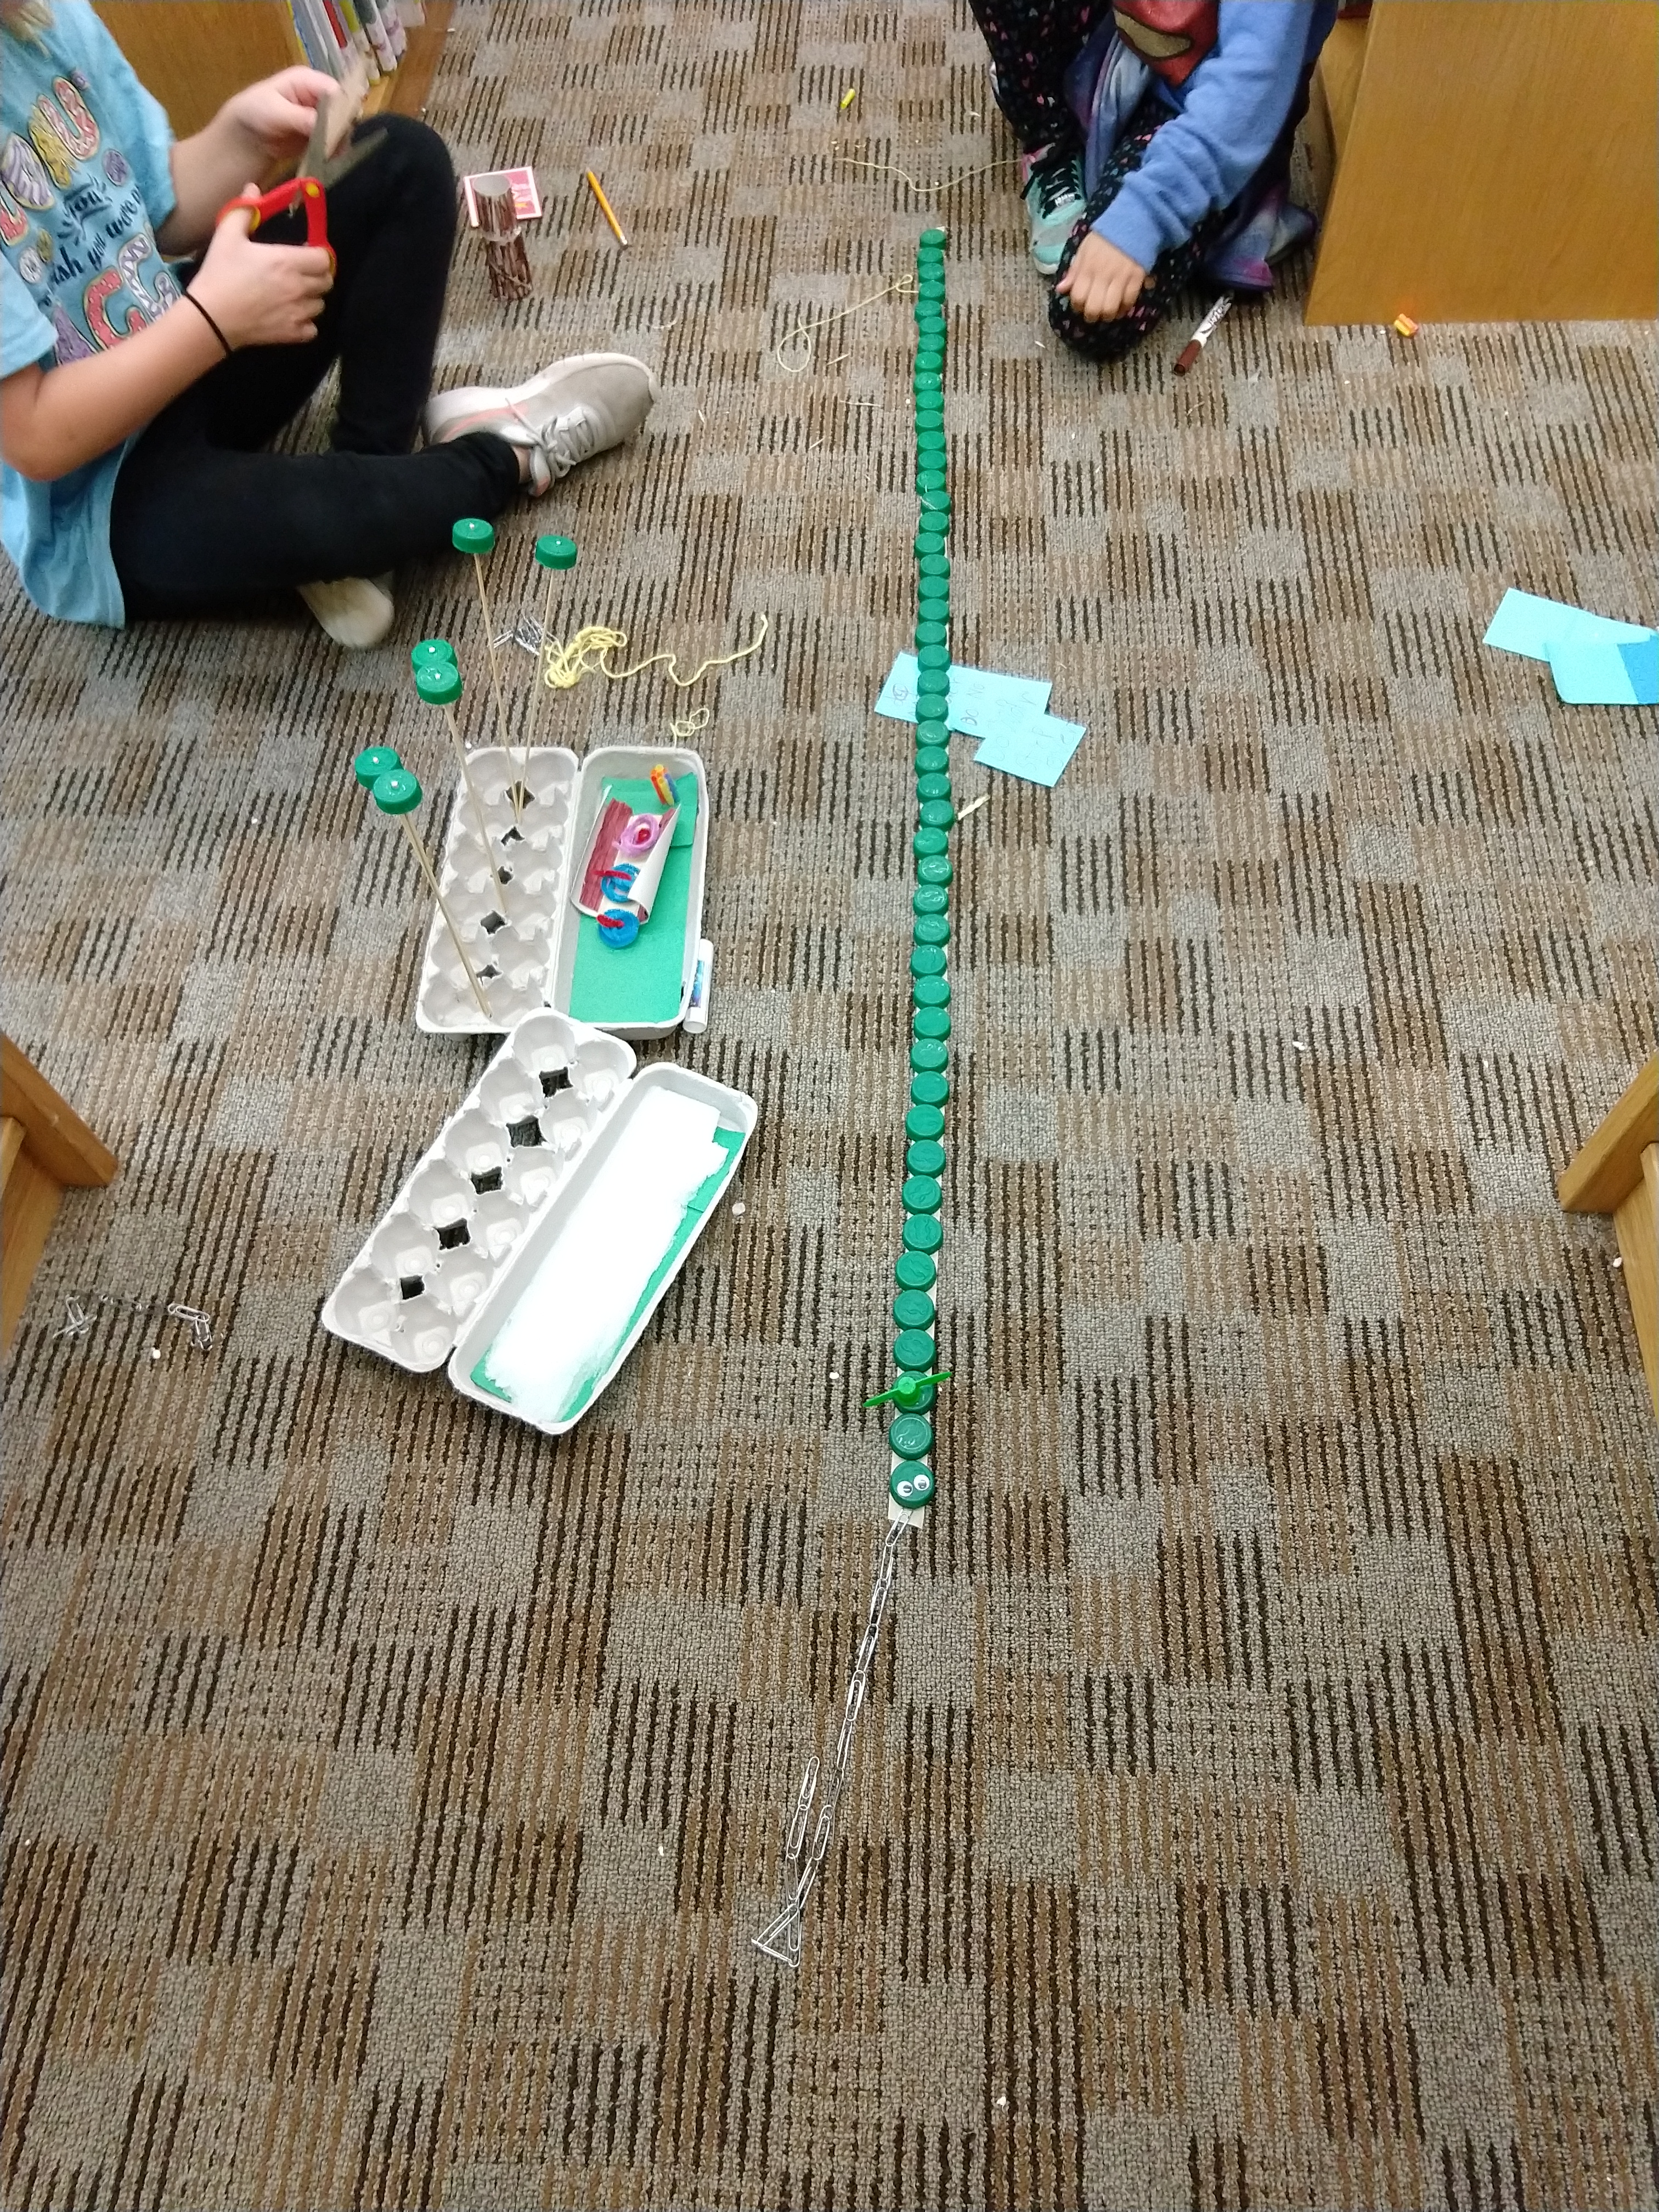
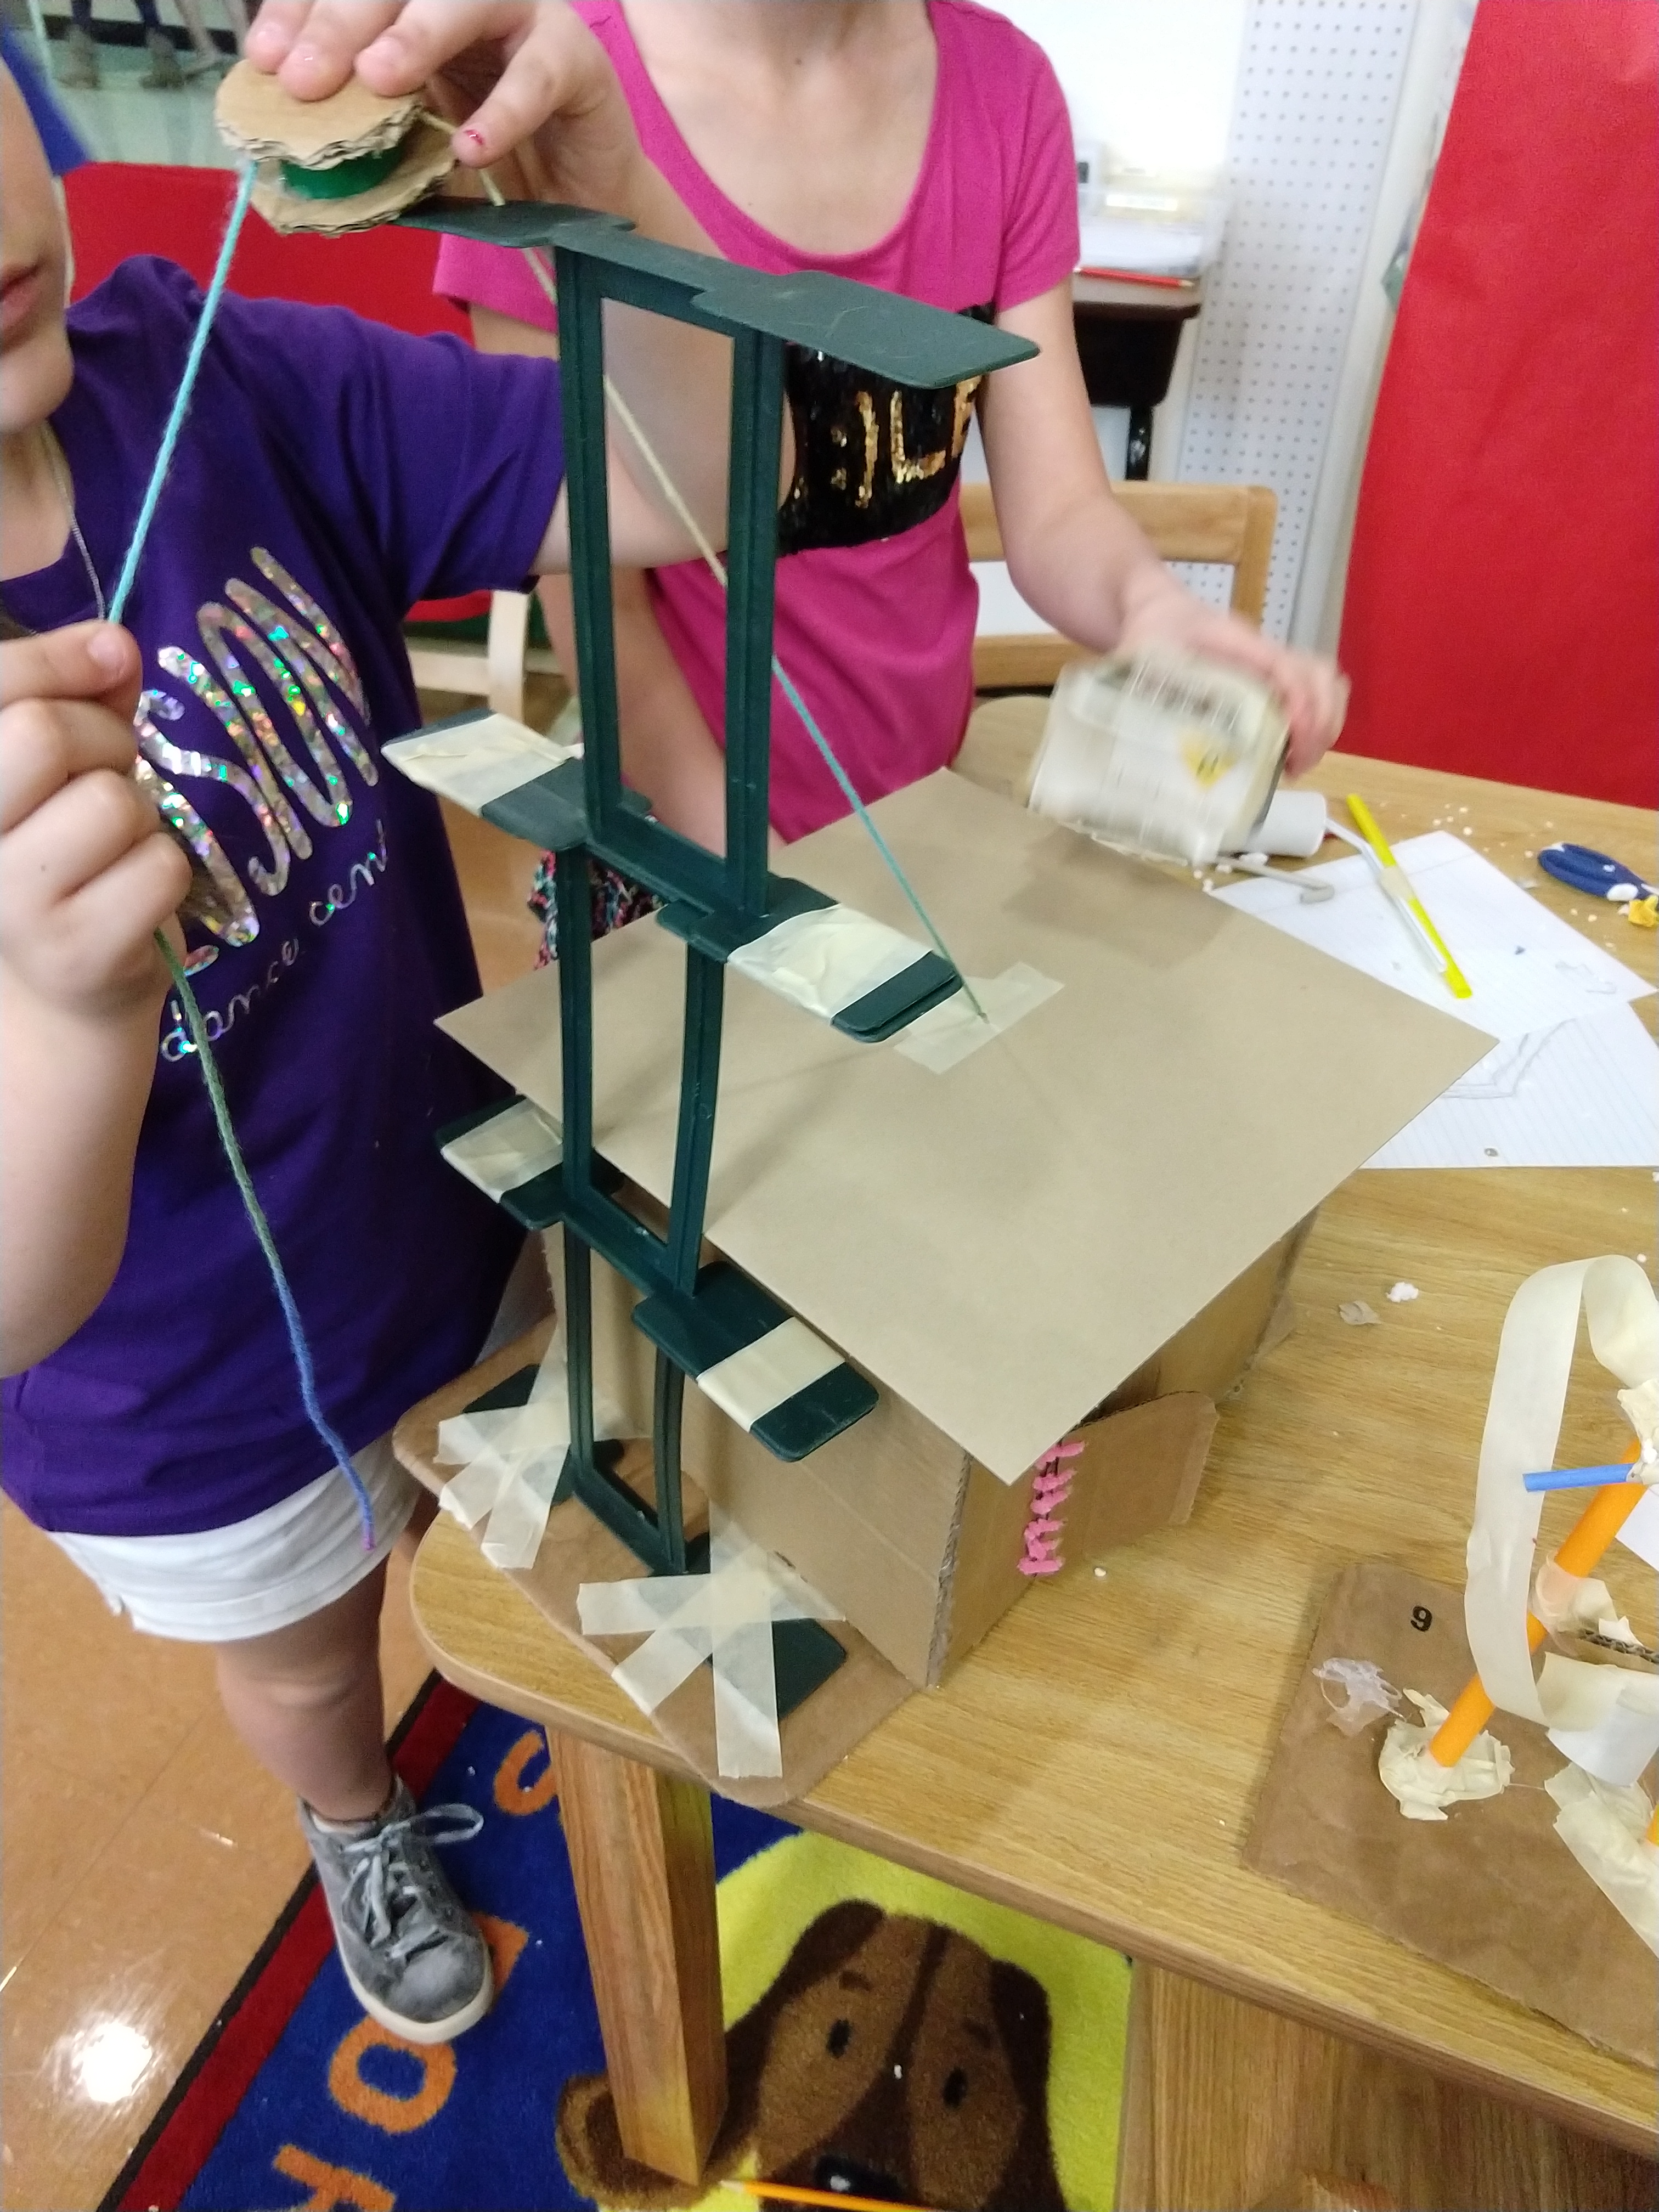
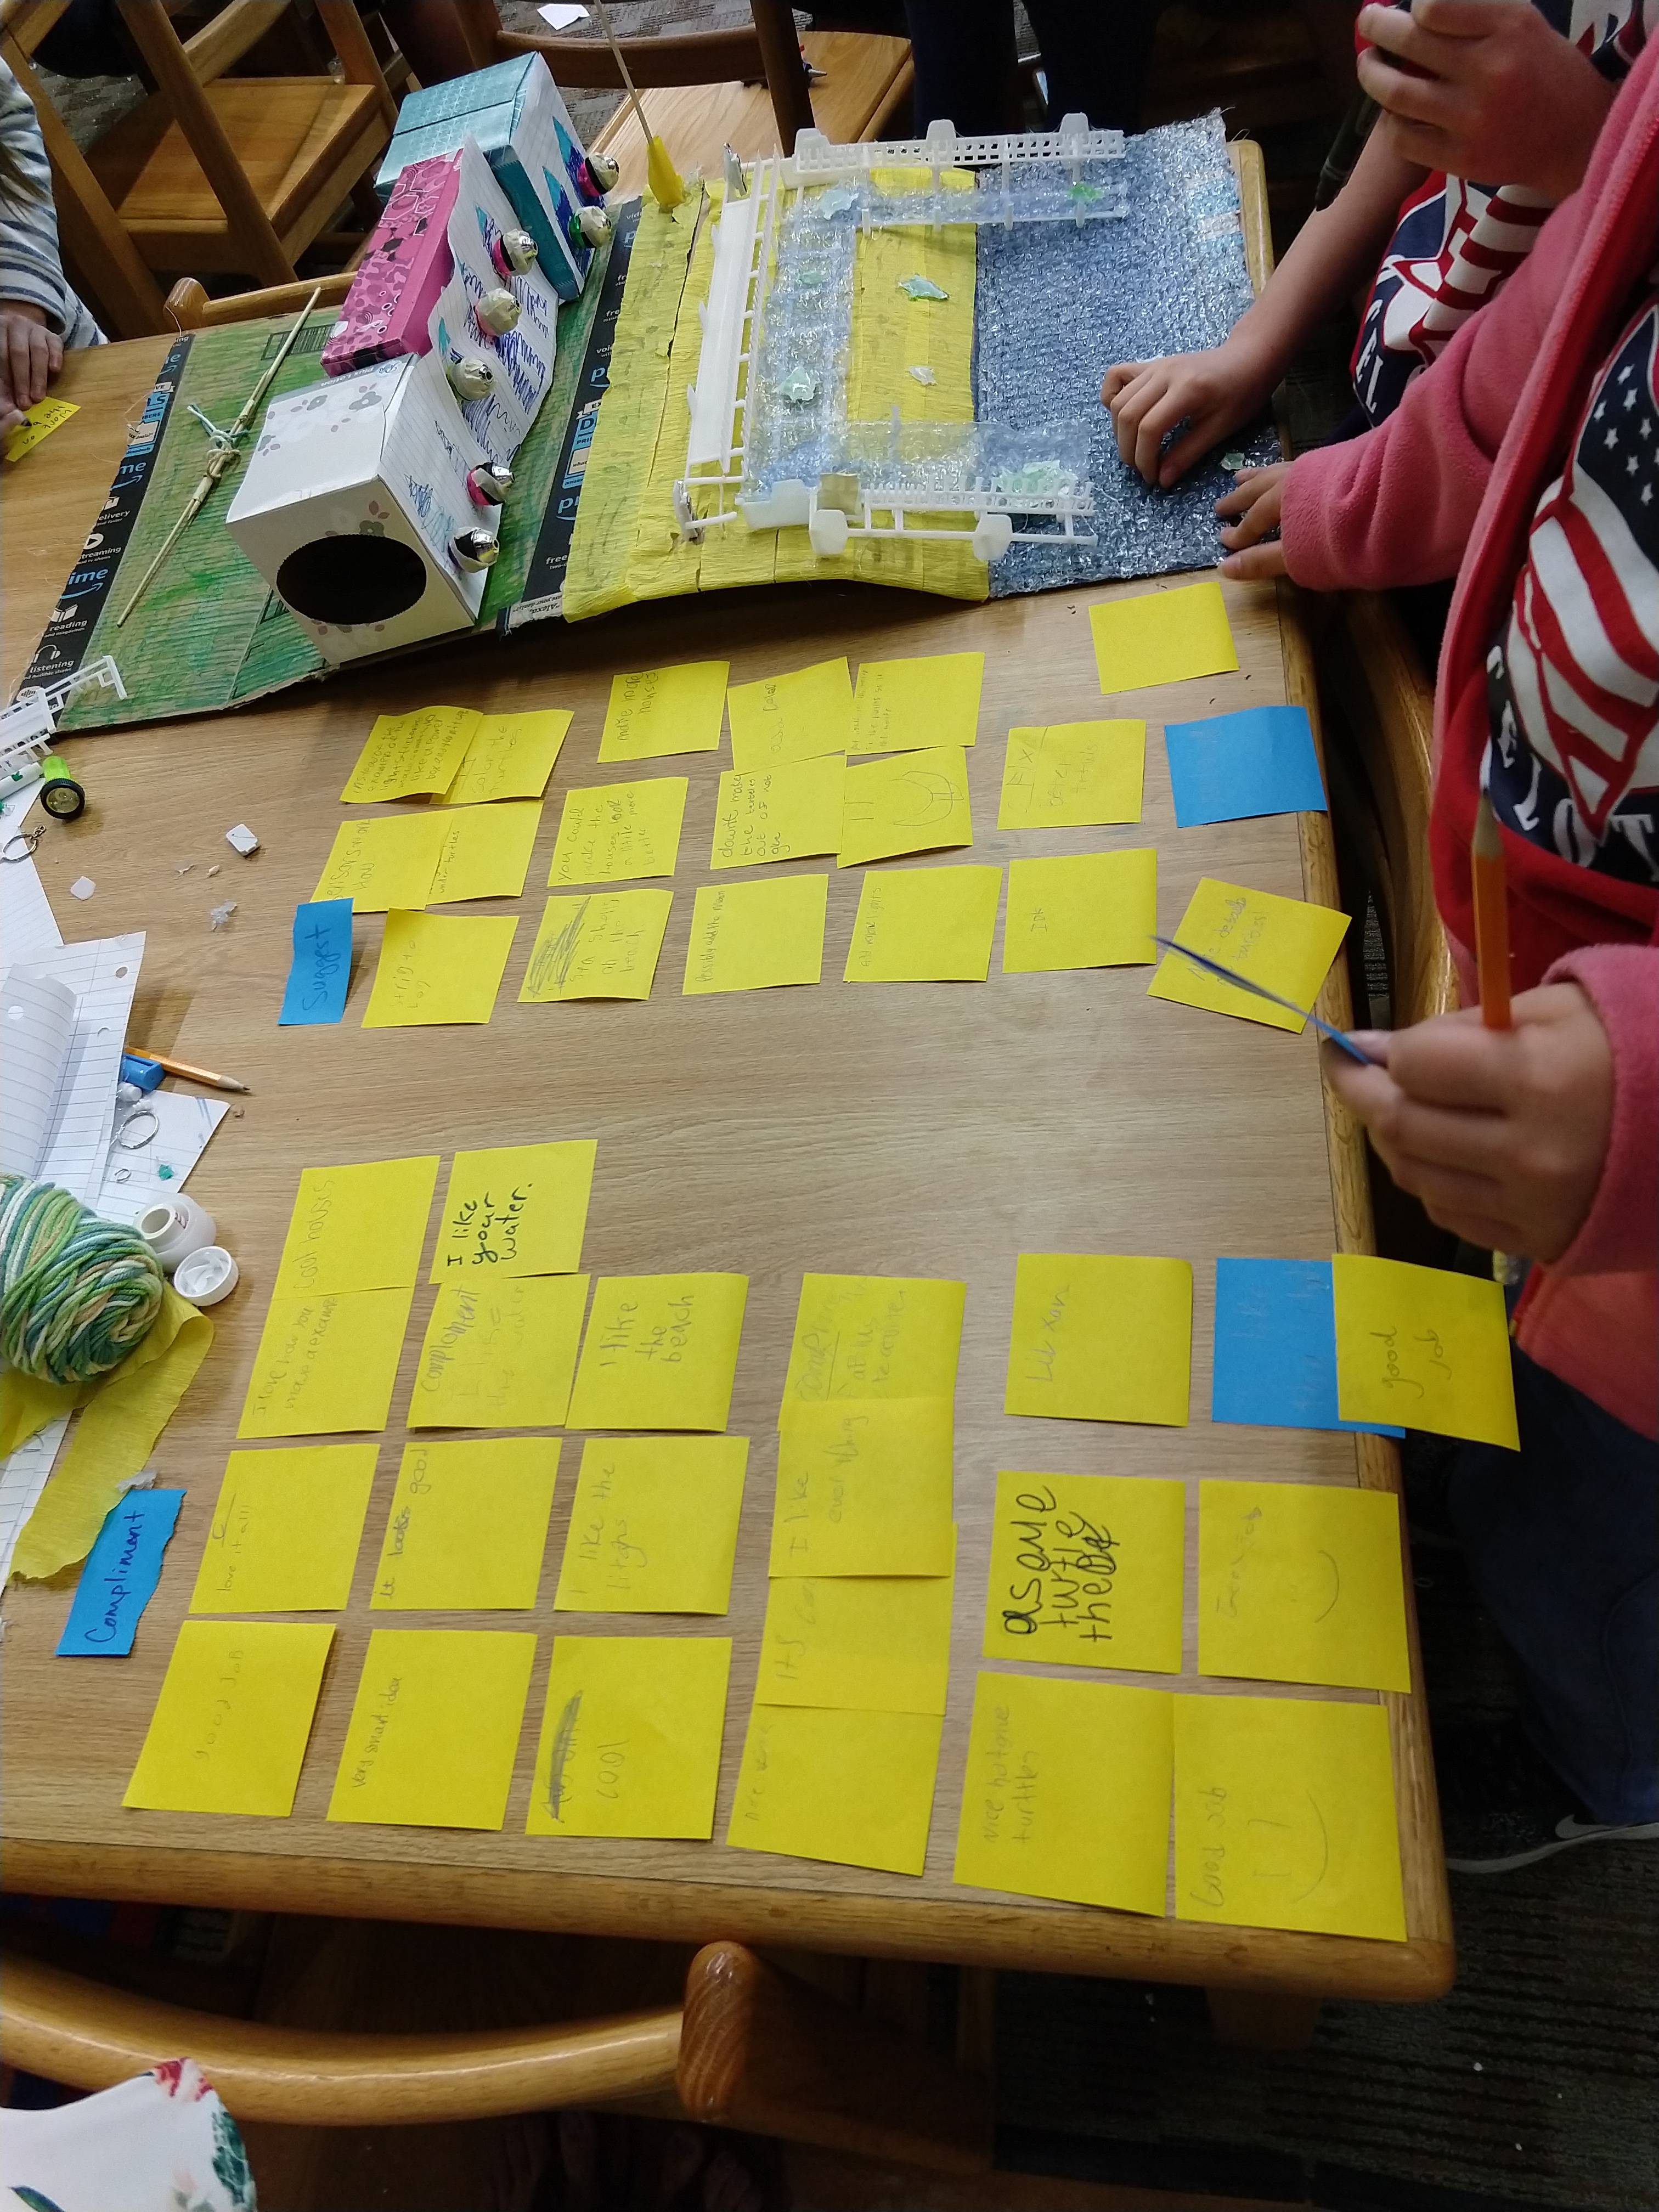
A pilot was conducted with a group of six students from 3rd-5th grade. The students were very excited to create objects based on books they had read and they enjoyed sharing thoughts about the characters, environments, and story lines. Students loved giving each other feedback on their prototypes (e.g., using post its to provide compliments and actionable suggestions) and iterating the designs during the engineering design process. They especially enjoyed displaying their finished work on the library shelves for their peers to see later. As a bonus, the librarian noticed that other students who were passing by the hallway came and came inside to ask what was going on because they wanted to make something too. This successful pilot inspired the librarian to create a special event “A Day of Novel Engineering” as the reward for students who read a certain number of state award books.
Implementation
To facilitate and implement the event, I helped the librarian develop protocols for teachers and parents to grant the students permission to miss regular class for a day in order to spend the day in the library for the event. To help with supervision, my teacher education students and I volunteered to help facilitate small groups throughout the day. To ensure there were enough craft materials available for the students to use, I helped the librarian set up a materials donation box in the front office. Over the course of a few weeks a variety of materials were donated, including cleaned recyclable materials, scrap craft supplies, and new packages of tape and hot glue.
Impact
The inaugural event was well-attended by 20 students who met the reading goal, which was three more students than the previous school year. The following school year there were over 40 students who qualified to attend the event, which was double from the inaugural event and indicated a significant increase in student reading engagement. Below, you can see images from the student interactions at the event.
Improving the service design of self-directed elementary library makerspace
Project overview
Problem
A local elementary librarian was looking for ways to introduce self-service maker activities in their elementary library that a) were safe for their wide-range of students and b) could increase engagement in classroom-related learning.
Method
This project was completed in four weeks. Service design methods were used, which employed a collaborative, iterative process that focused on human-centered approaches and design thinking:
- discovery (e.g., customer consultation and value proposition; empathizing through observation and creating an empathy map),
- interpretation (e.g., searching for meaning, framing opportunities),
- ideation (e.g., collaborative brainstorming, collaboratively creating service design blueprint),
- experimentation (e.g., designing props and resources, testing with students, focus group for feedback), and
- evolution (e.g., reflecting on process, iterating for improved service design, designing final user flow).
Impact
The improved service-design optimized safety by 68% for the 500+ students and teachers who used the self-service makerspace lab.
My role
I led consultations with the librarian and volunteers, which included facilitating human-centered approaches to optimize the makerspace service, observing needs, identifying opportunities, and designing options for self-directed activities with safe materials that the elementary students could easily use without adult assistance. Additionally, I collaborated with my own university students to develop instructional materials to be included in the space.
Process details
Discovery
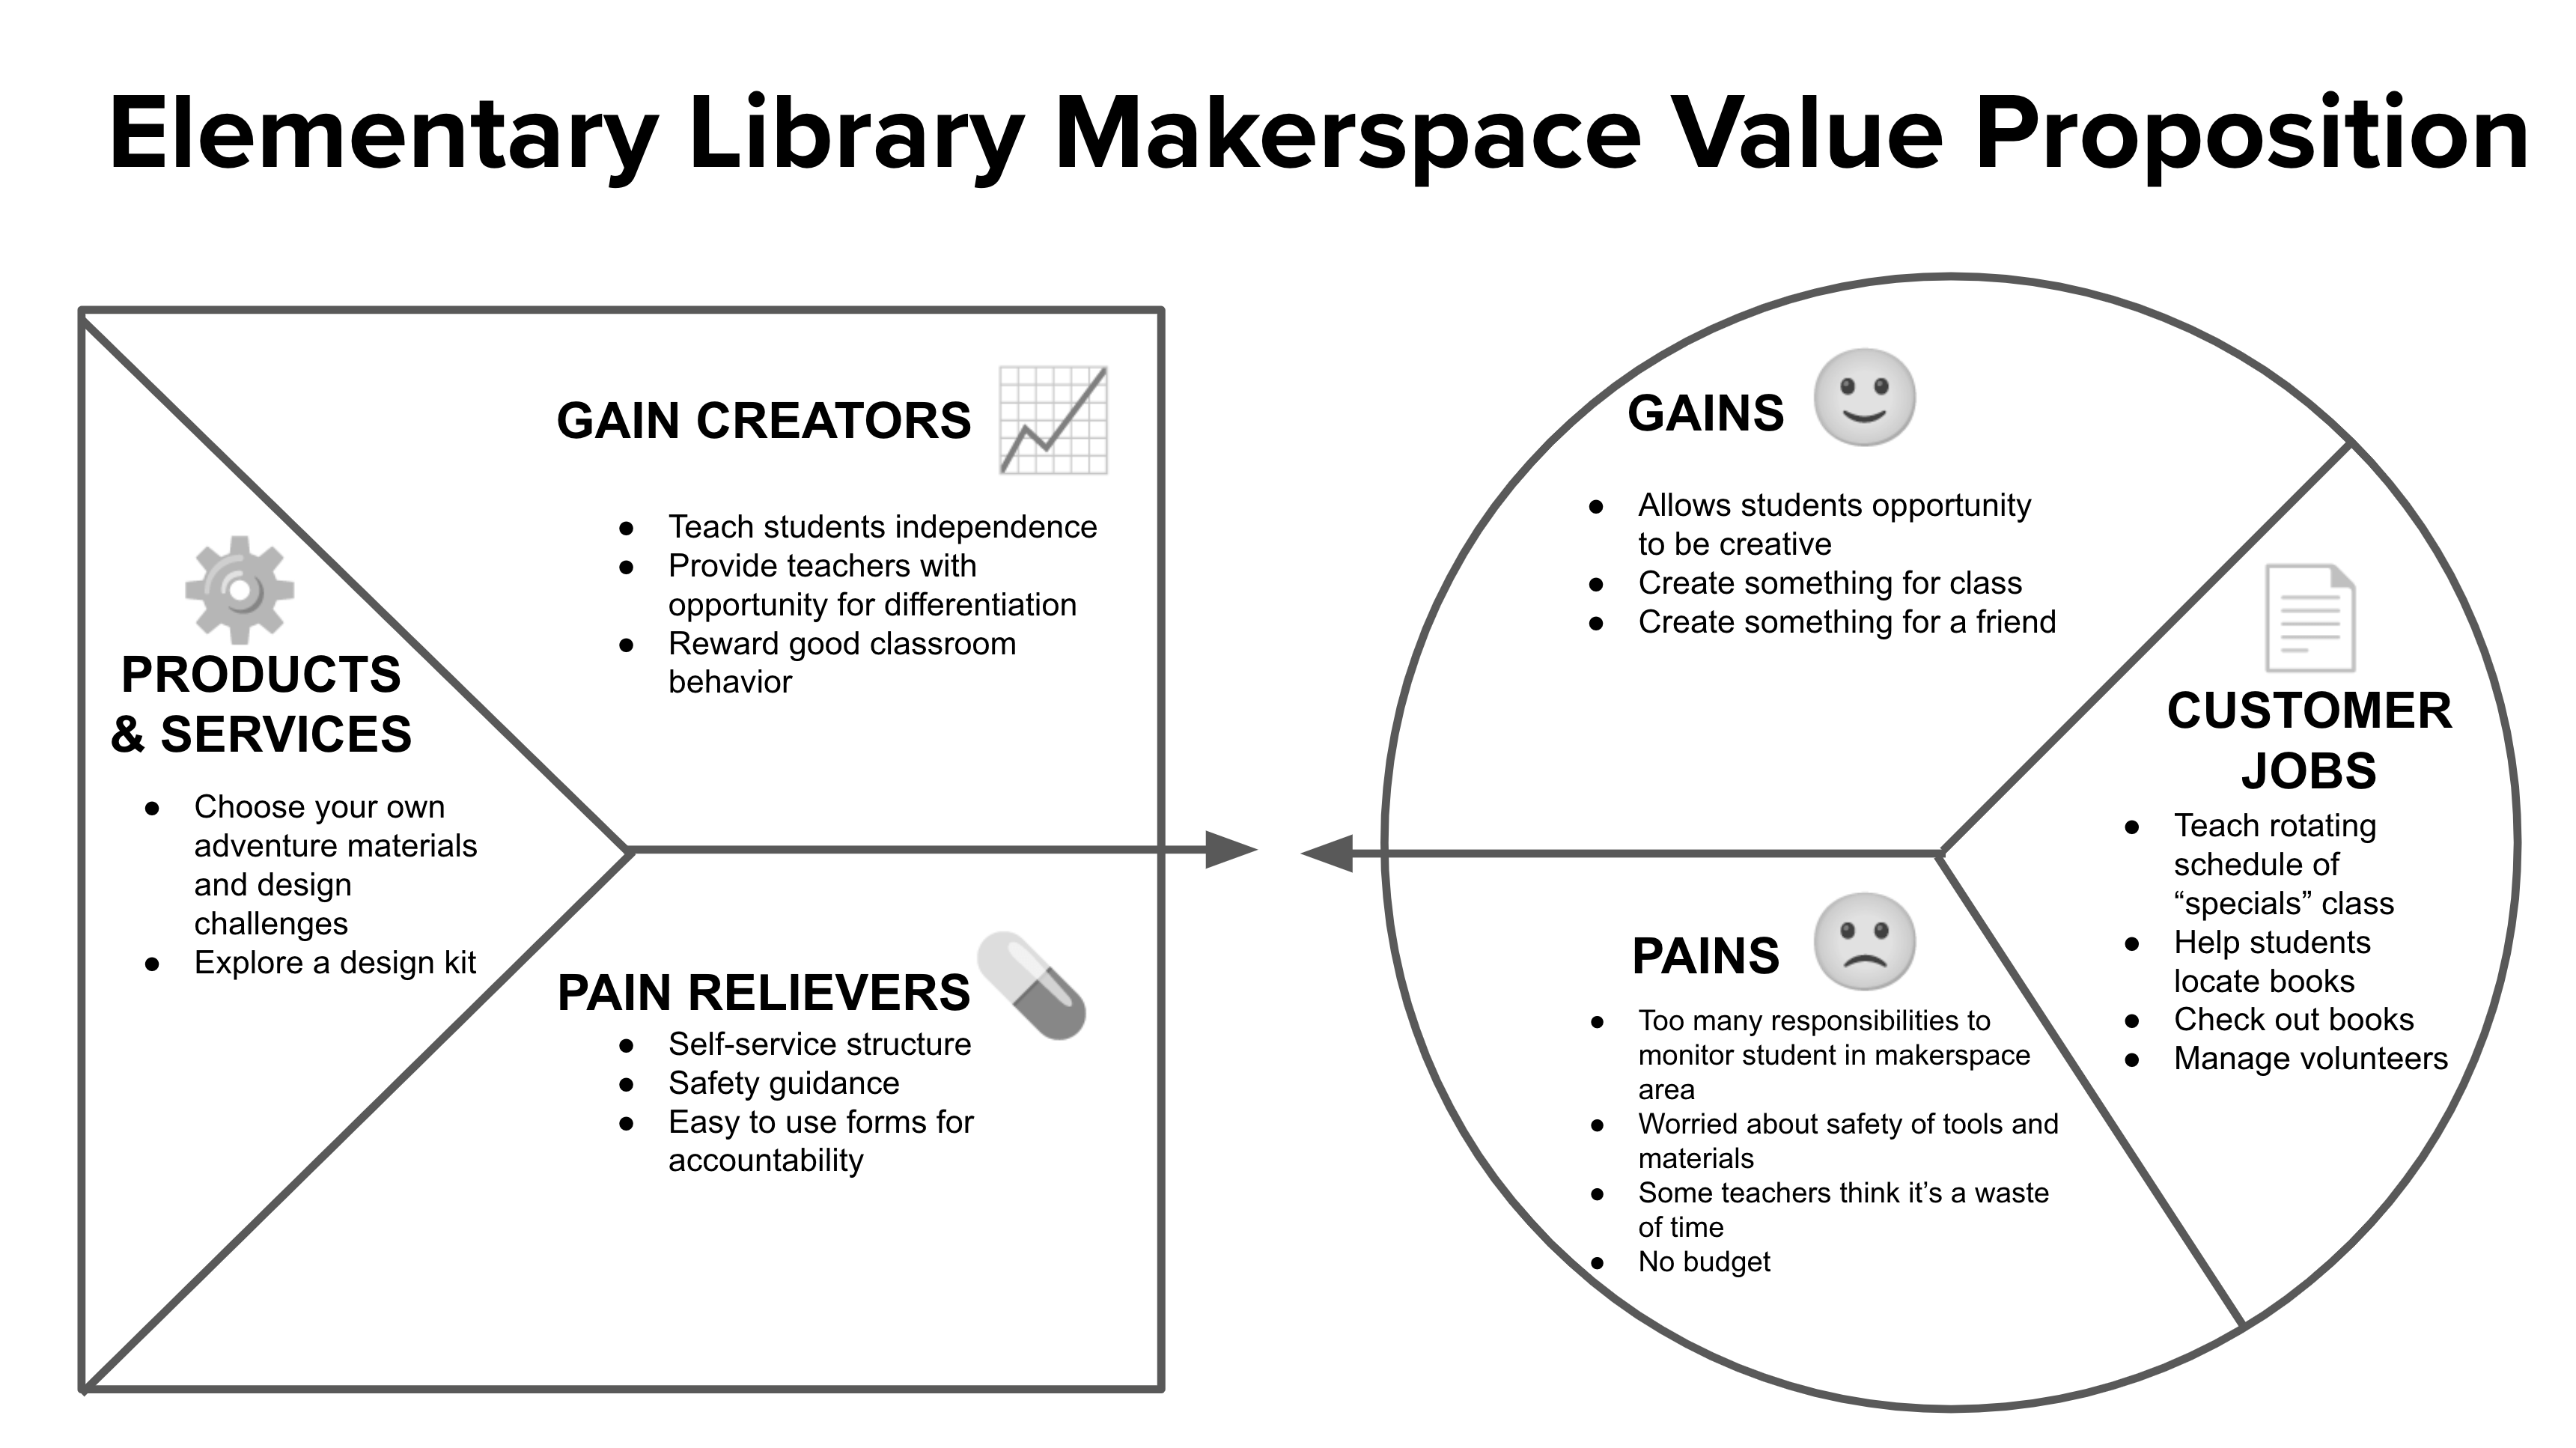
This project focused on 1) designing a space that was conducive for self-directed student activities and 2) designing activities that connected the making to reading and classroom concepts. The first step in the process was discovering user needs. I began with a kickoff meeting to understand the librarian’s potential pains, gains, and day-to-day jobs, which we collaboratively mapped on a value proposition canvas together (see Figure 2).
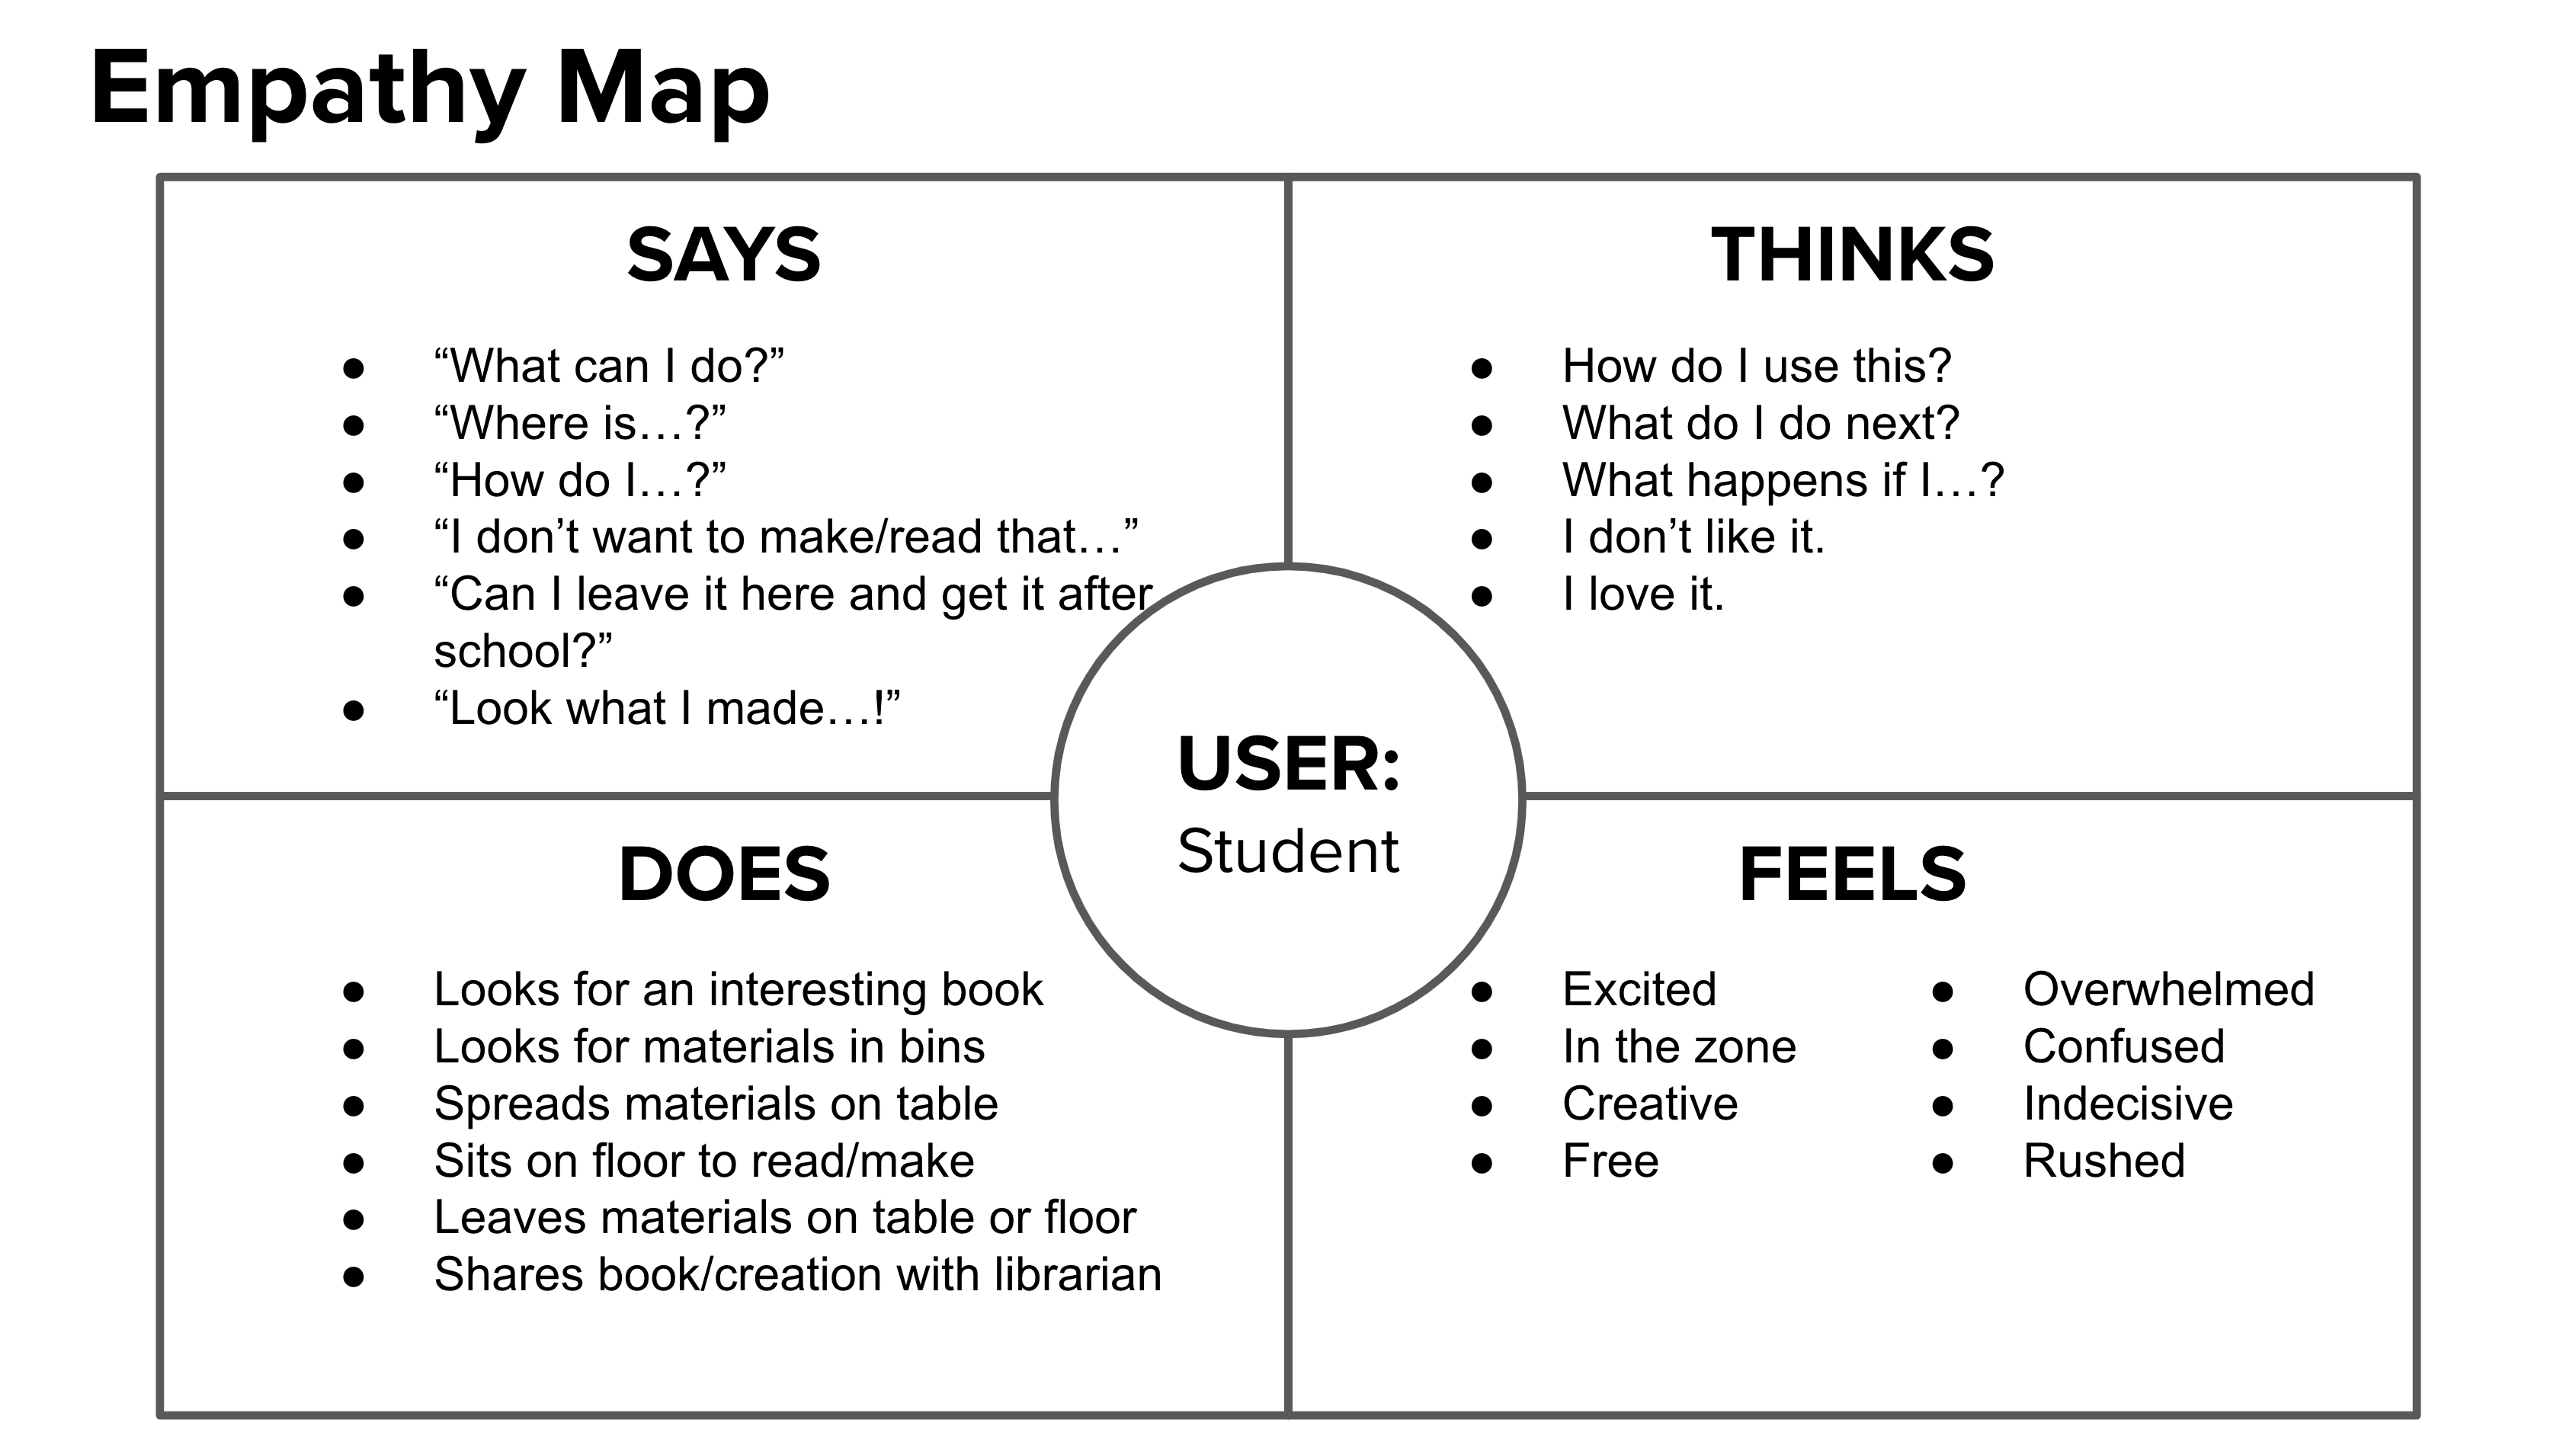
I then observed the needs of the librarian and the students in the context of the library space, which was used to create an empathy map to help the librarian further understand the needs for the space (see Figure 3). I spent one day observing in the library so I could see what a typical day was like for the librarian (e.g., teaching literacy lessons to classes on the “specials” schedule, helping students find books of interest, and managing volunteers who monitored book check-in and check-out). These observations aligned with the value proposition that we had collaboratively made beforehand.
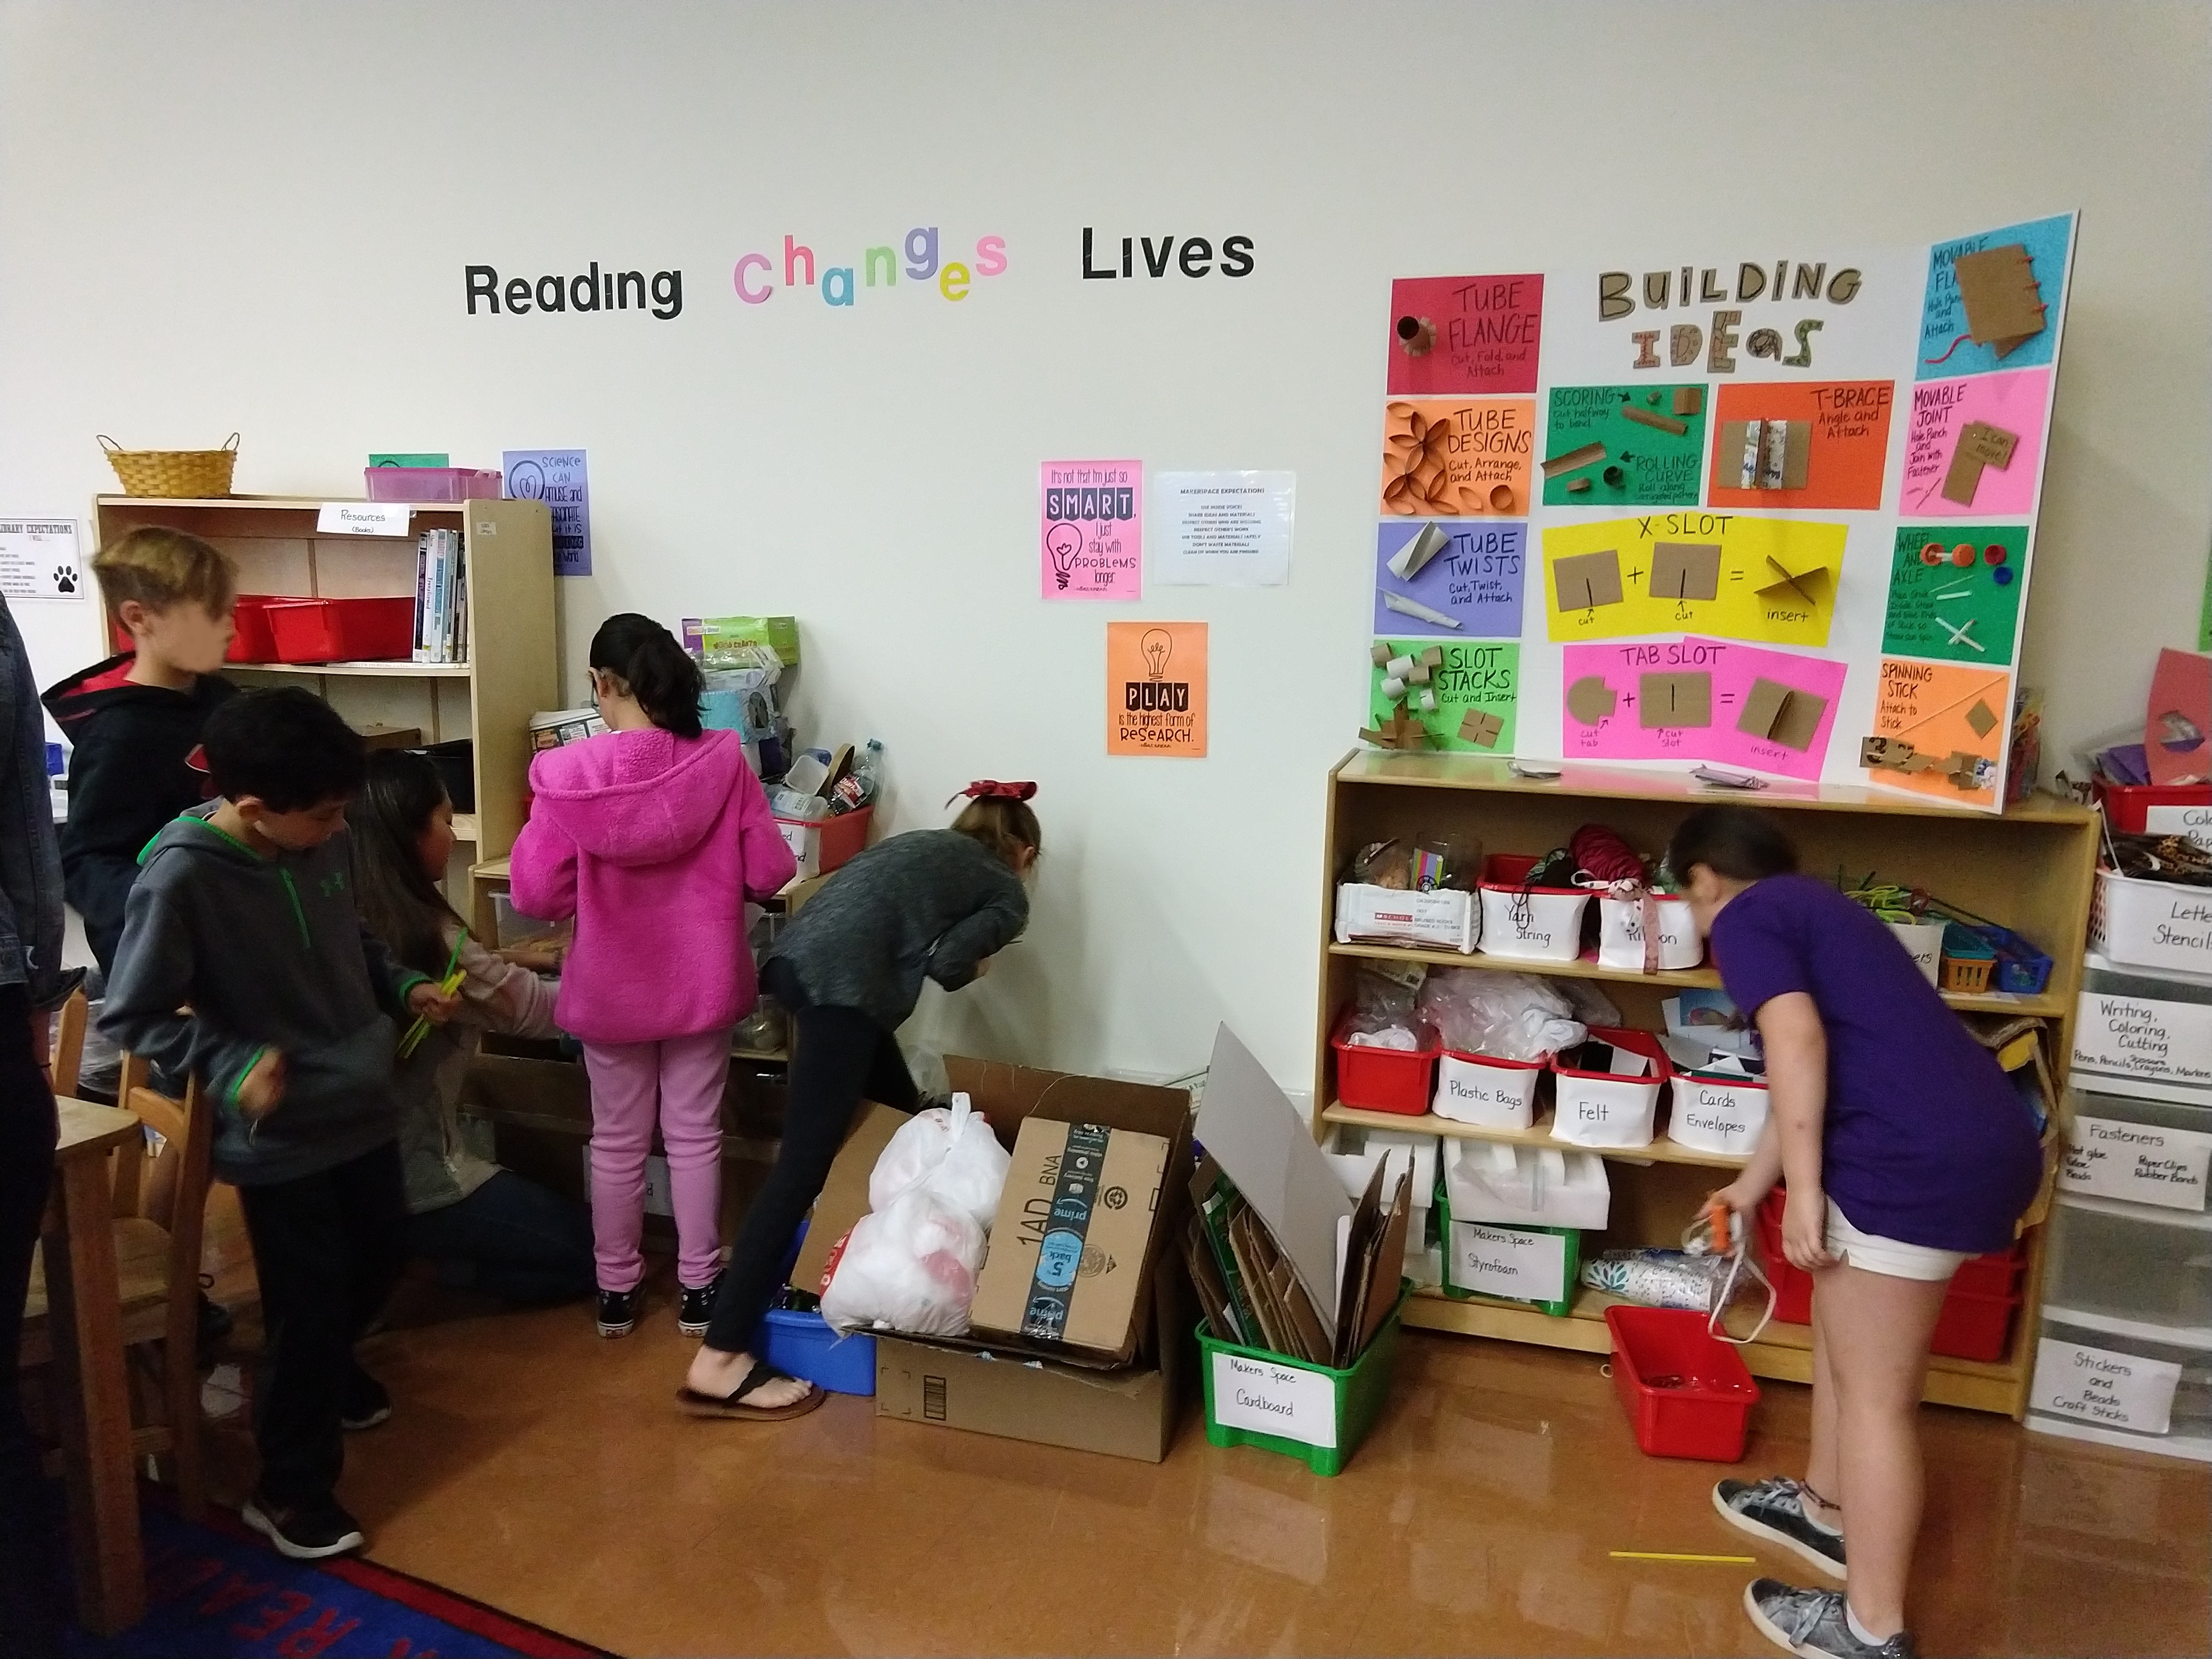
Additionally, I spent a day observing different groups of students as they engaged in various activities within the library (e.g., looking for interesting books on curated collection shelves, sitting in chairs and on the floor to read books and write book reports, working on assignments for class, and considering craft materials in the makeshift makerspace corner area but not using them).
Interpretation
During my interpretation of the observations, I noticed that 1) the librarian and the volunteers were consistently busy overseeing classes and individual student book needs and 2) a small corner in the library with various craft materials was not used much throughout the day. I posed the following How Might We question to help frame opportunities:
“How might we design a self-directed makerspace area in the library for elementary students so that they can safely make creations related to their reading or learning?”
Ideation
The ideation step involved debriefing with the librarian and volunteers to discuss observations and define opportunities to address needs on sticky notes. First, we discussed how students could use the space without adult supervision to find a balance between desirability, feasibility, and viability. When considering tools and materials, we focused heavily on safety. The librarian provided a list of items that had previously caused minor incidents requiring a band-aid or a quick visit to the nurse’s office, estimating about 25 such incidents over a semester. Because there was no budget, we discussed what materials the librarian already had access to, which included various kits (e.g., Legos, Snap Circuits, Little Bits) and craft materials (e.g., adhesives, recyclables, donated ribbon) they had been collecting in the back room. We also considered what types of examples could be created to visually demonstrate techniques (i.e., minimize the need for instructions).
Lastly, we discussed how they anticipated a student could enter and move through the space. The librarian came up with the idea that teachers could award students with a “Maker Pass”, which they could use for 30 minutes during free time (e.g., recess) or when they’d completed their class work early. We concluded that we could focus students’ efforts into two categories to allow them the choice between learning something new through a kit or completing a design challenge prompt using available craft materials. To create this student user flow we transformed the unused corner of the library by using old shelves to create stations: 1) sign-in/out, 2) kit options, and 3) challenge prompts and craft materials. We consulted with other librarians and makerspace facilitators (i.e., subject matter experts) via phone and email to gain feedback on our proposed solution.
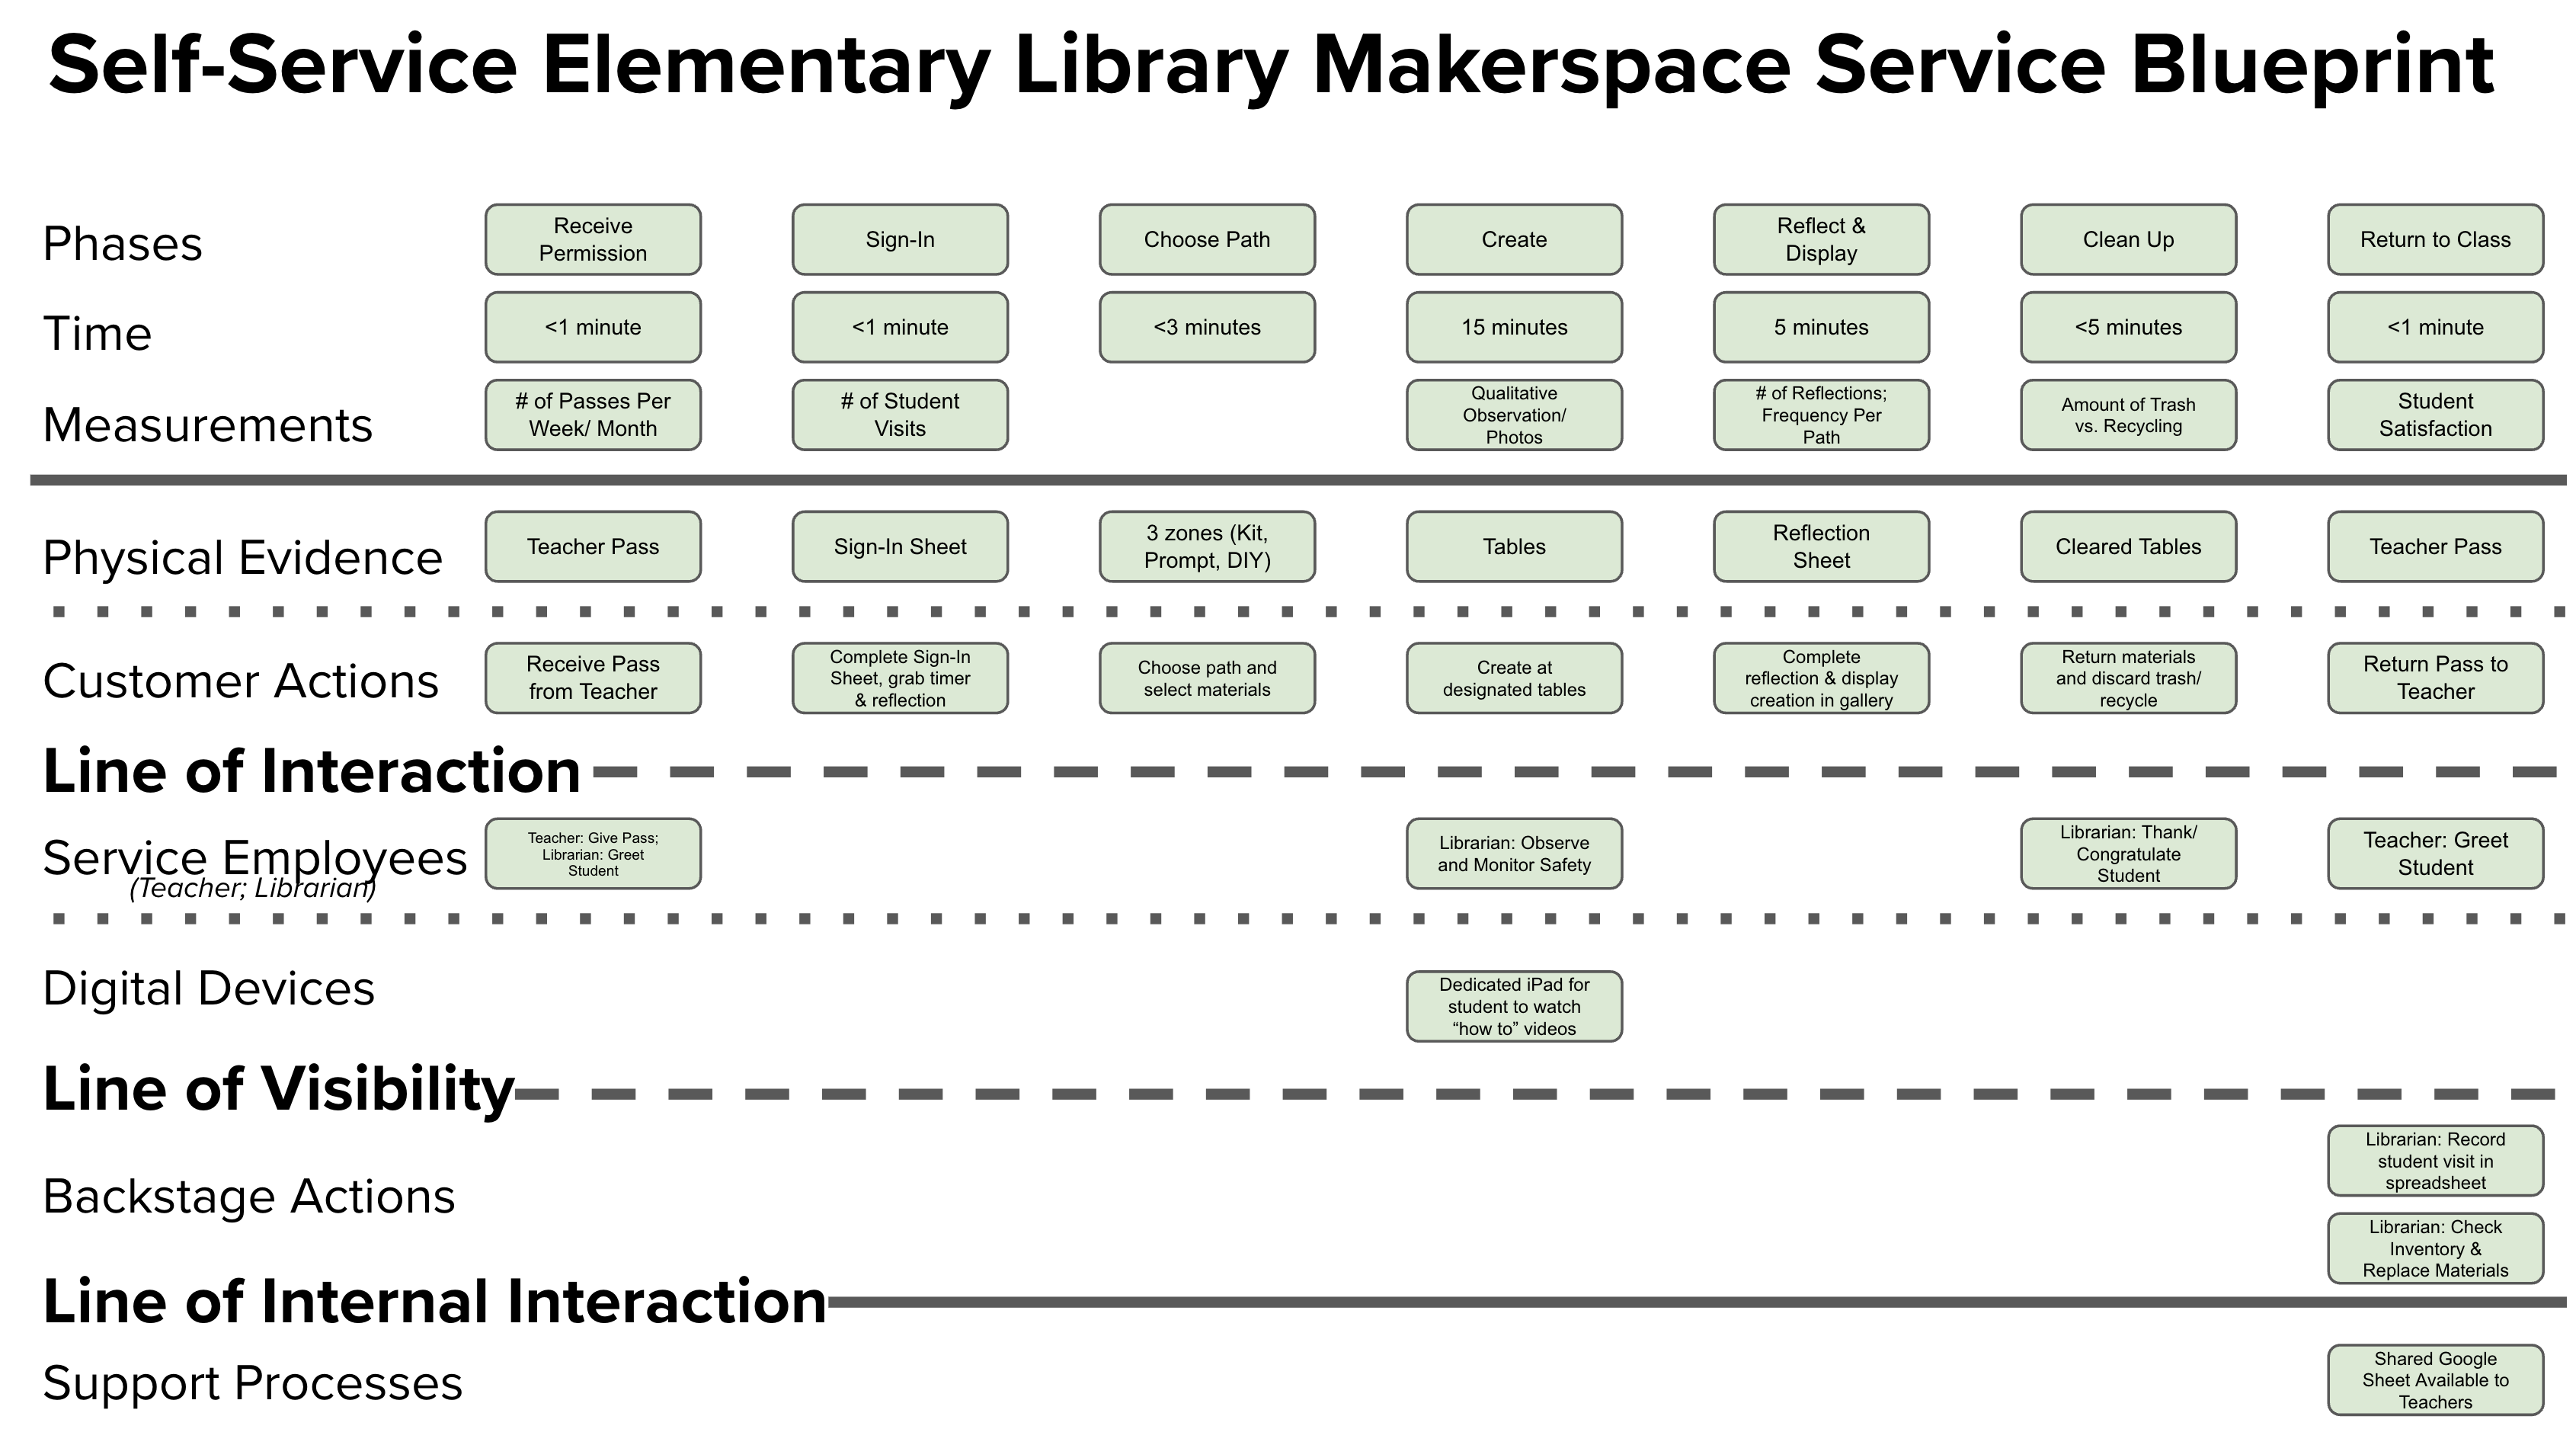
As we refined and aligned on these ideas, we collaboratively mapped out a service blueprint to visualize the relationship between the self-directed makerspace components, including people, props, and processes with frontstage and backstage actions (see Figure 4).
Experimentation
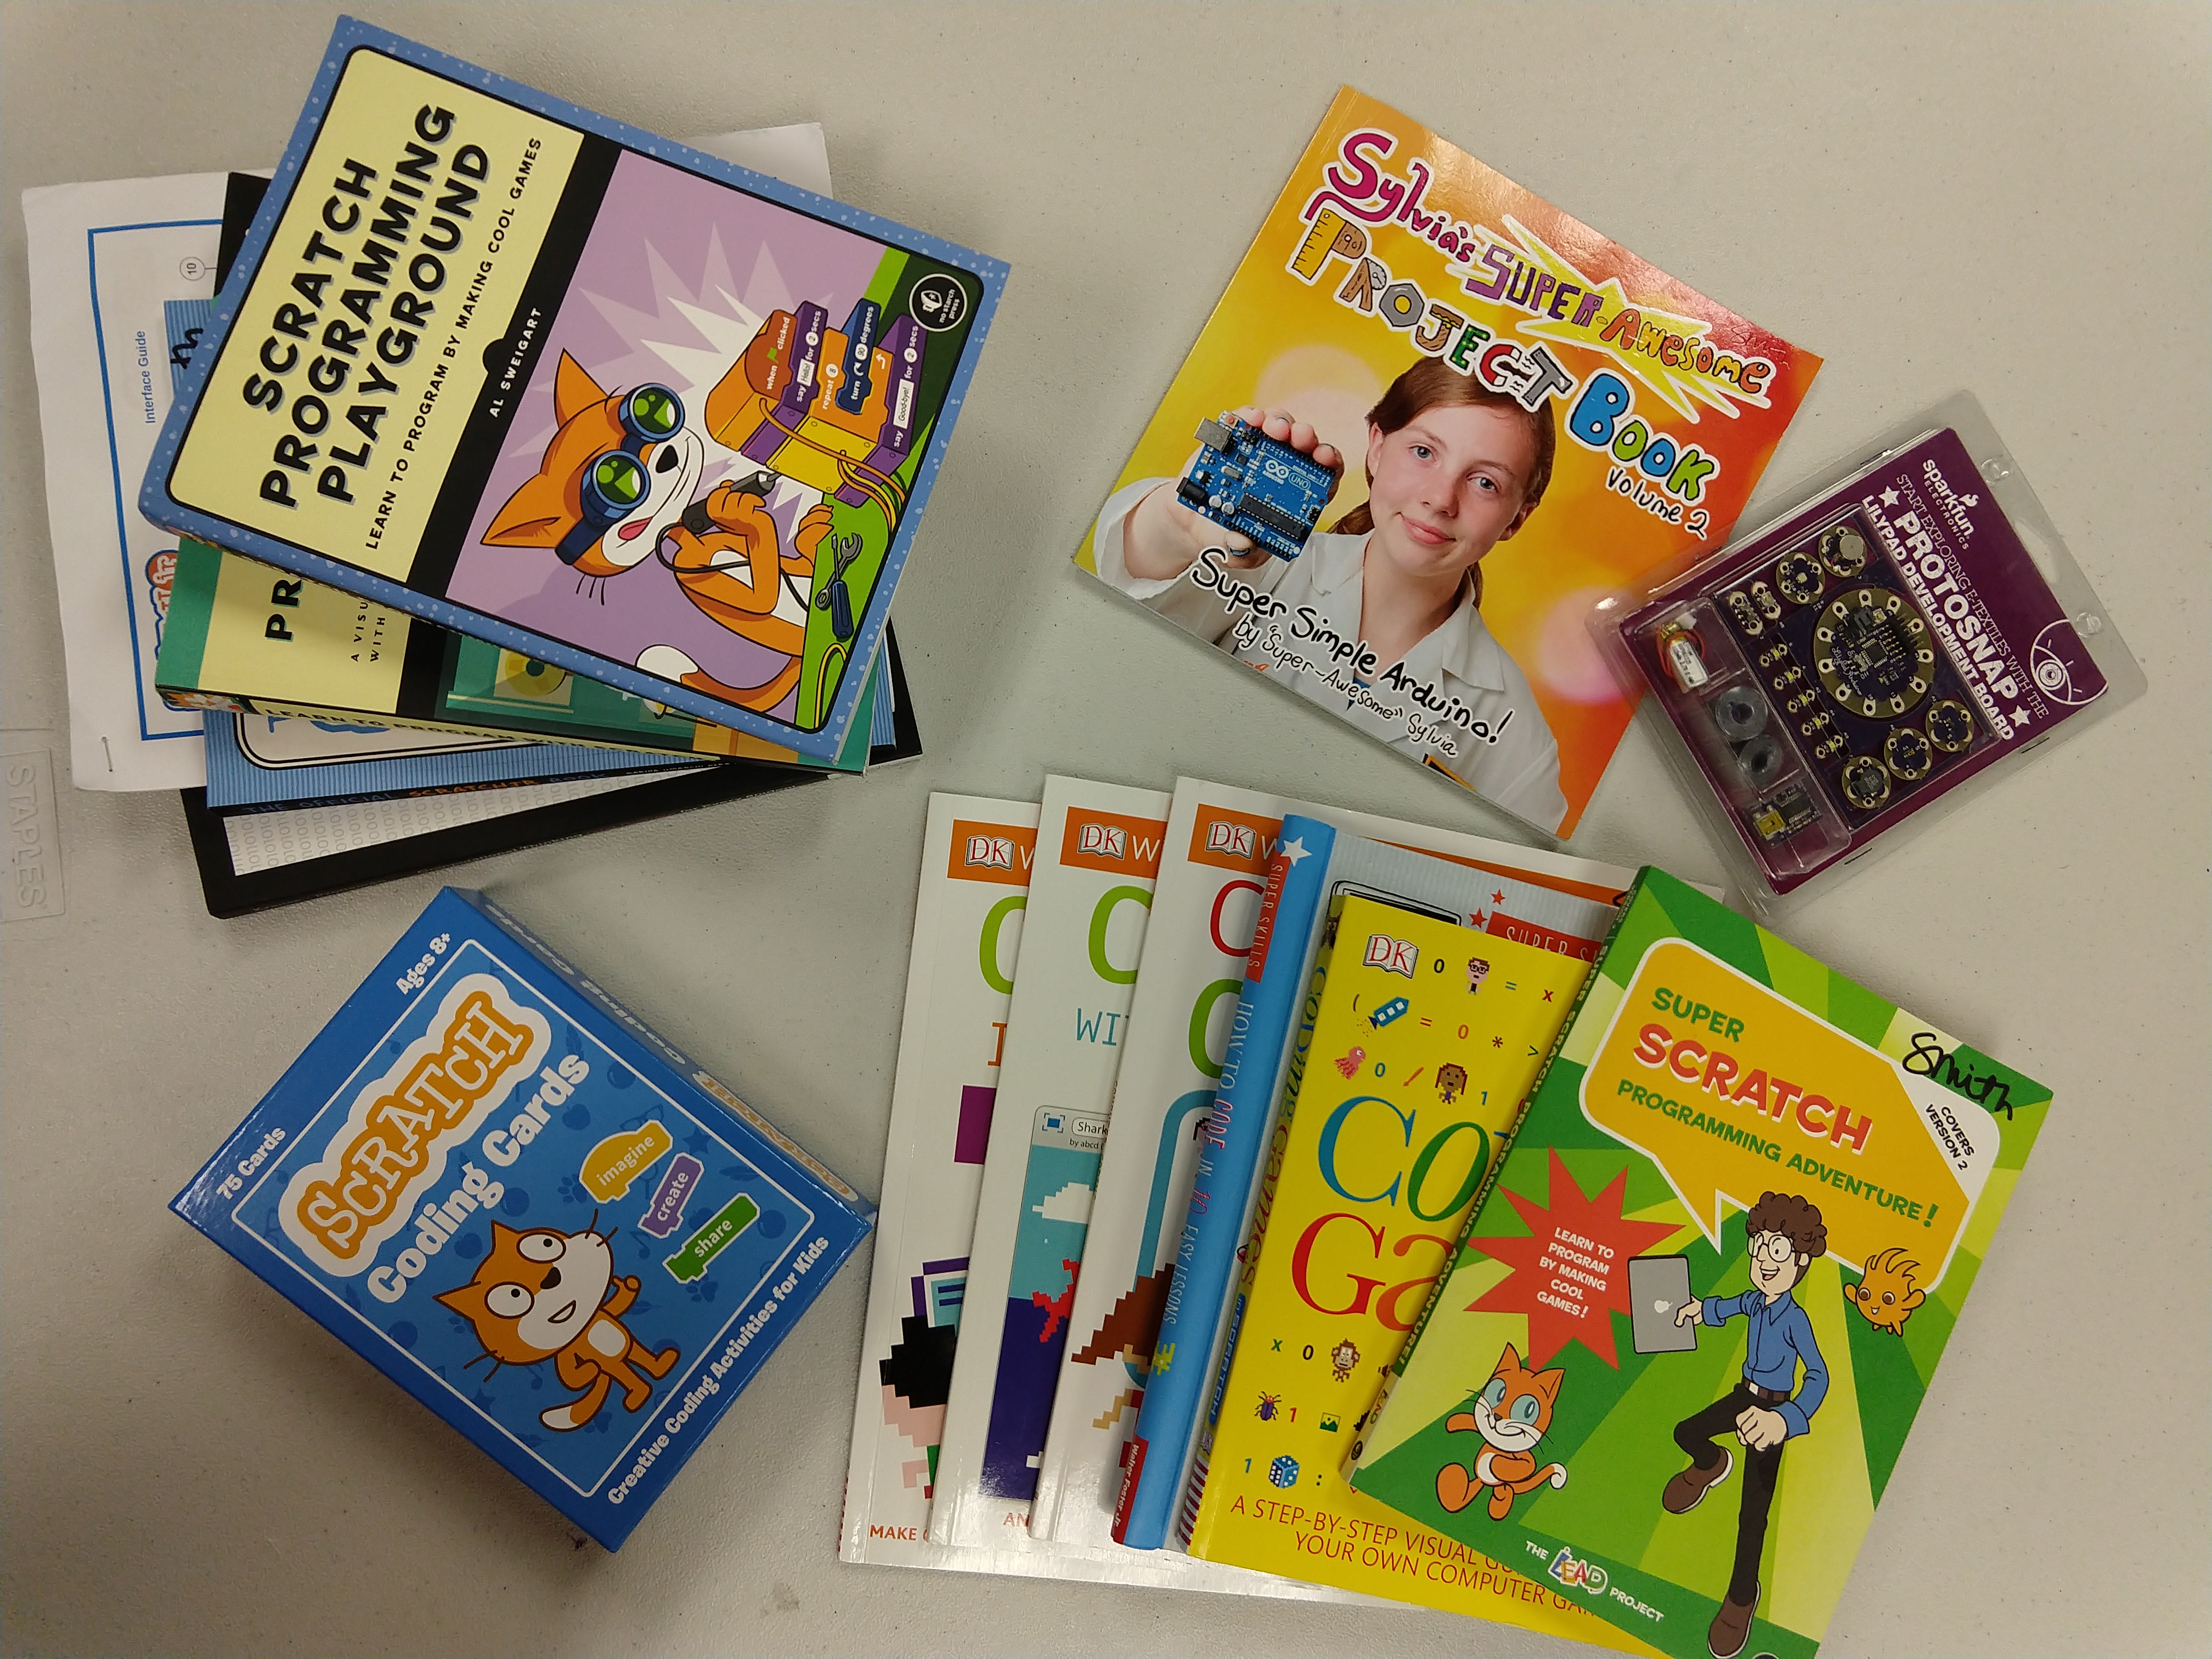
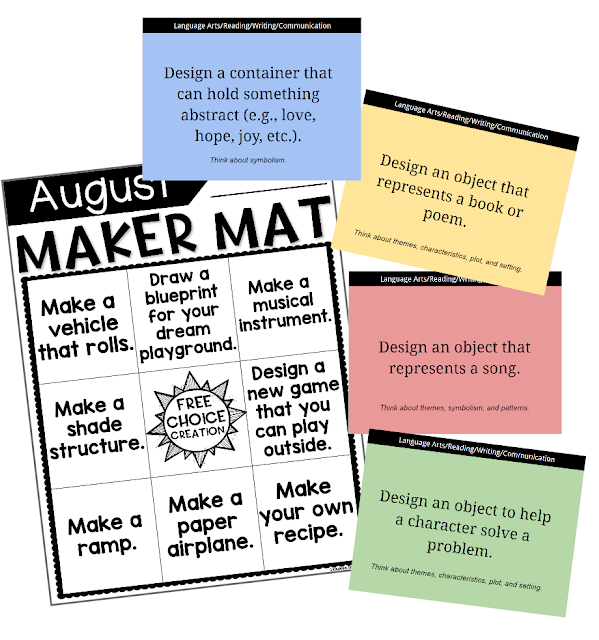
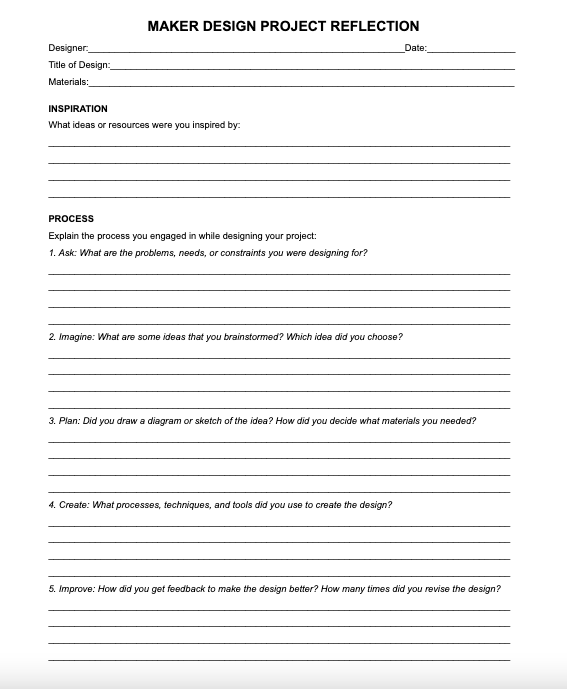
The experimentation step involved the development of design challenge prompts that the elementary students could use with the available craft materials without adult supervision. The librarian found some resources online while I had existing challenges to draw upon. Additionally, I chose to involve my university students (i.e. teacher education majors) to collaboratively generate new ideas. I hosted a one-hour brainstorming session where my university students and I examined existing design challenge prompt resource structures available online and discussed options for developing open-ended challenge prompts that targeted various content areas and approaches for assessment. I facilitated the session with sticky notes and whiteboard strategies to synthesize the group’s ideas (e.g., affinity mapping, dot voting), which were then assigned as tasks for my university students to develop into sets of challenge prompts and a makerspace reflection worksheet to serve as a formative assessment and accountability mechanism (see Figure 5 and 6). The completed prompts and reflection were shared with the librarian as a digital resource, which they printed and made available at the elementary makerspace.
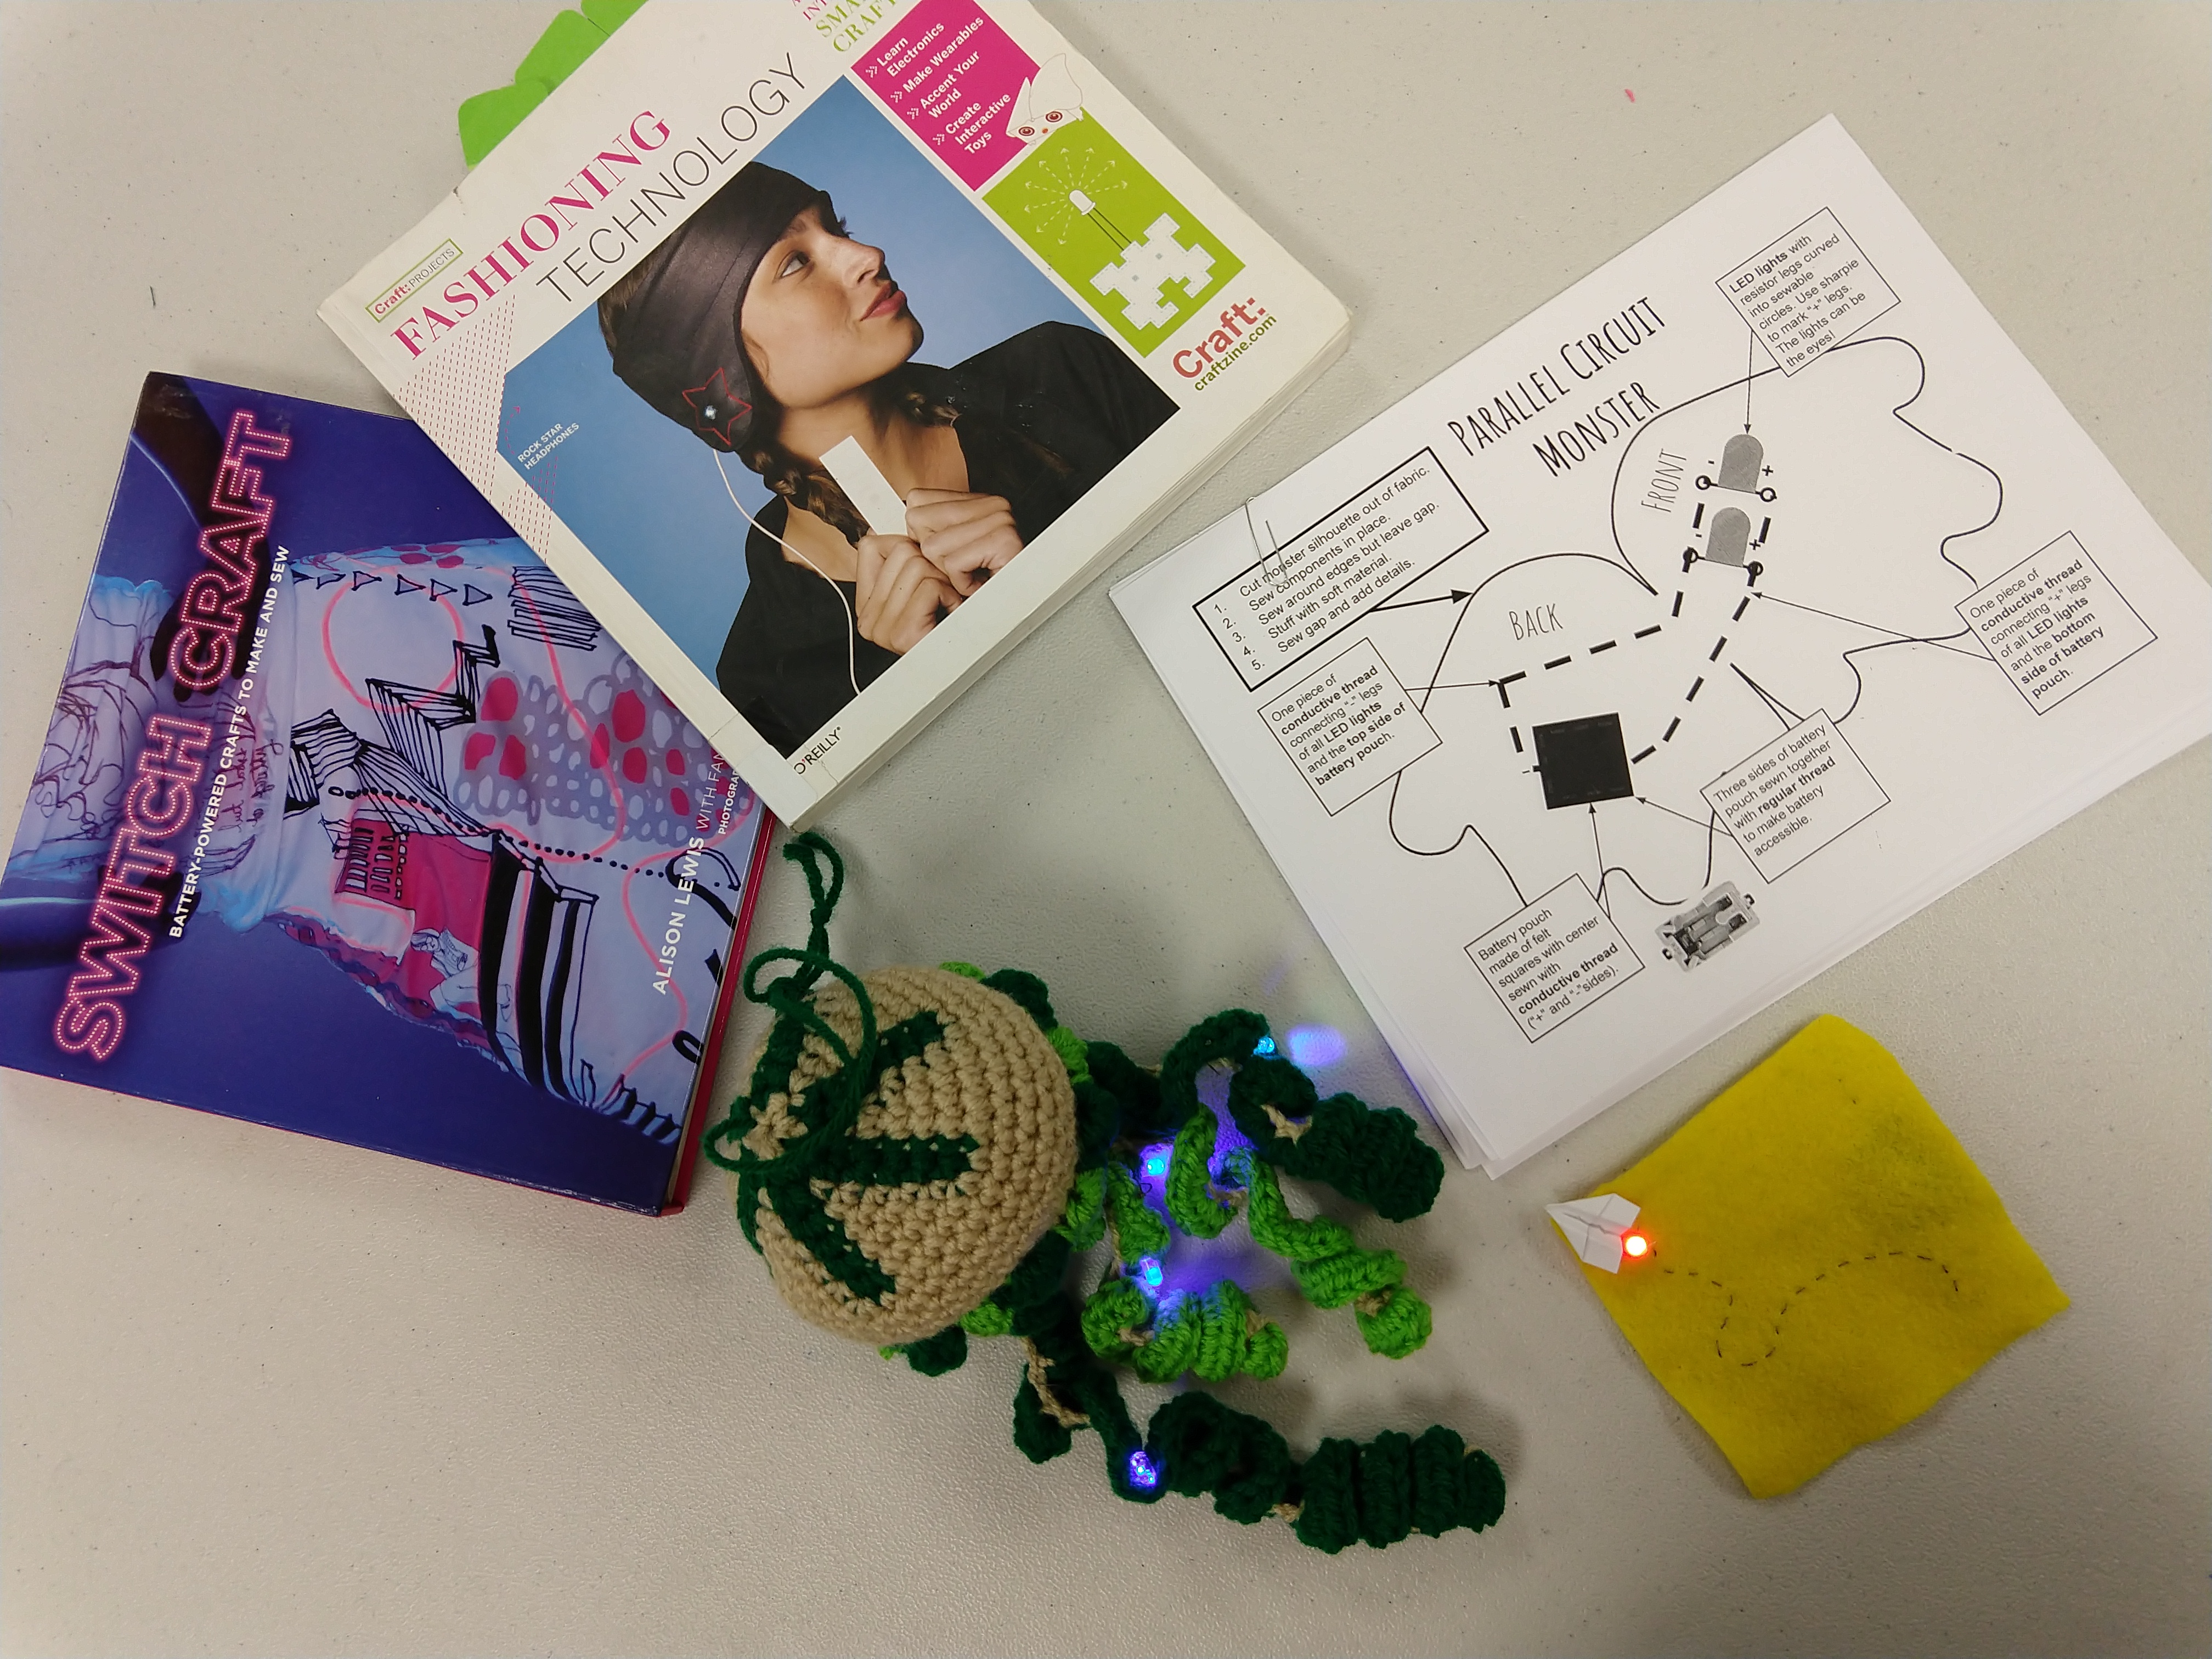
During the session, my university students also collaboratively wondered how they could develop engaging instructions for elementary students with varying reading abilities. After a quick scan of Pinterest (a.k.a., Every teacher’s go-to source of inspiration on a budget), my university students grabbed recyclable materials in our classroom and started making a portable inspiration board to provide friendly instructions and recyclable inspiration for the elementary students (see Figure 7).
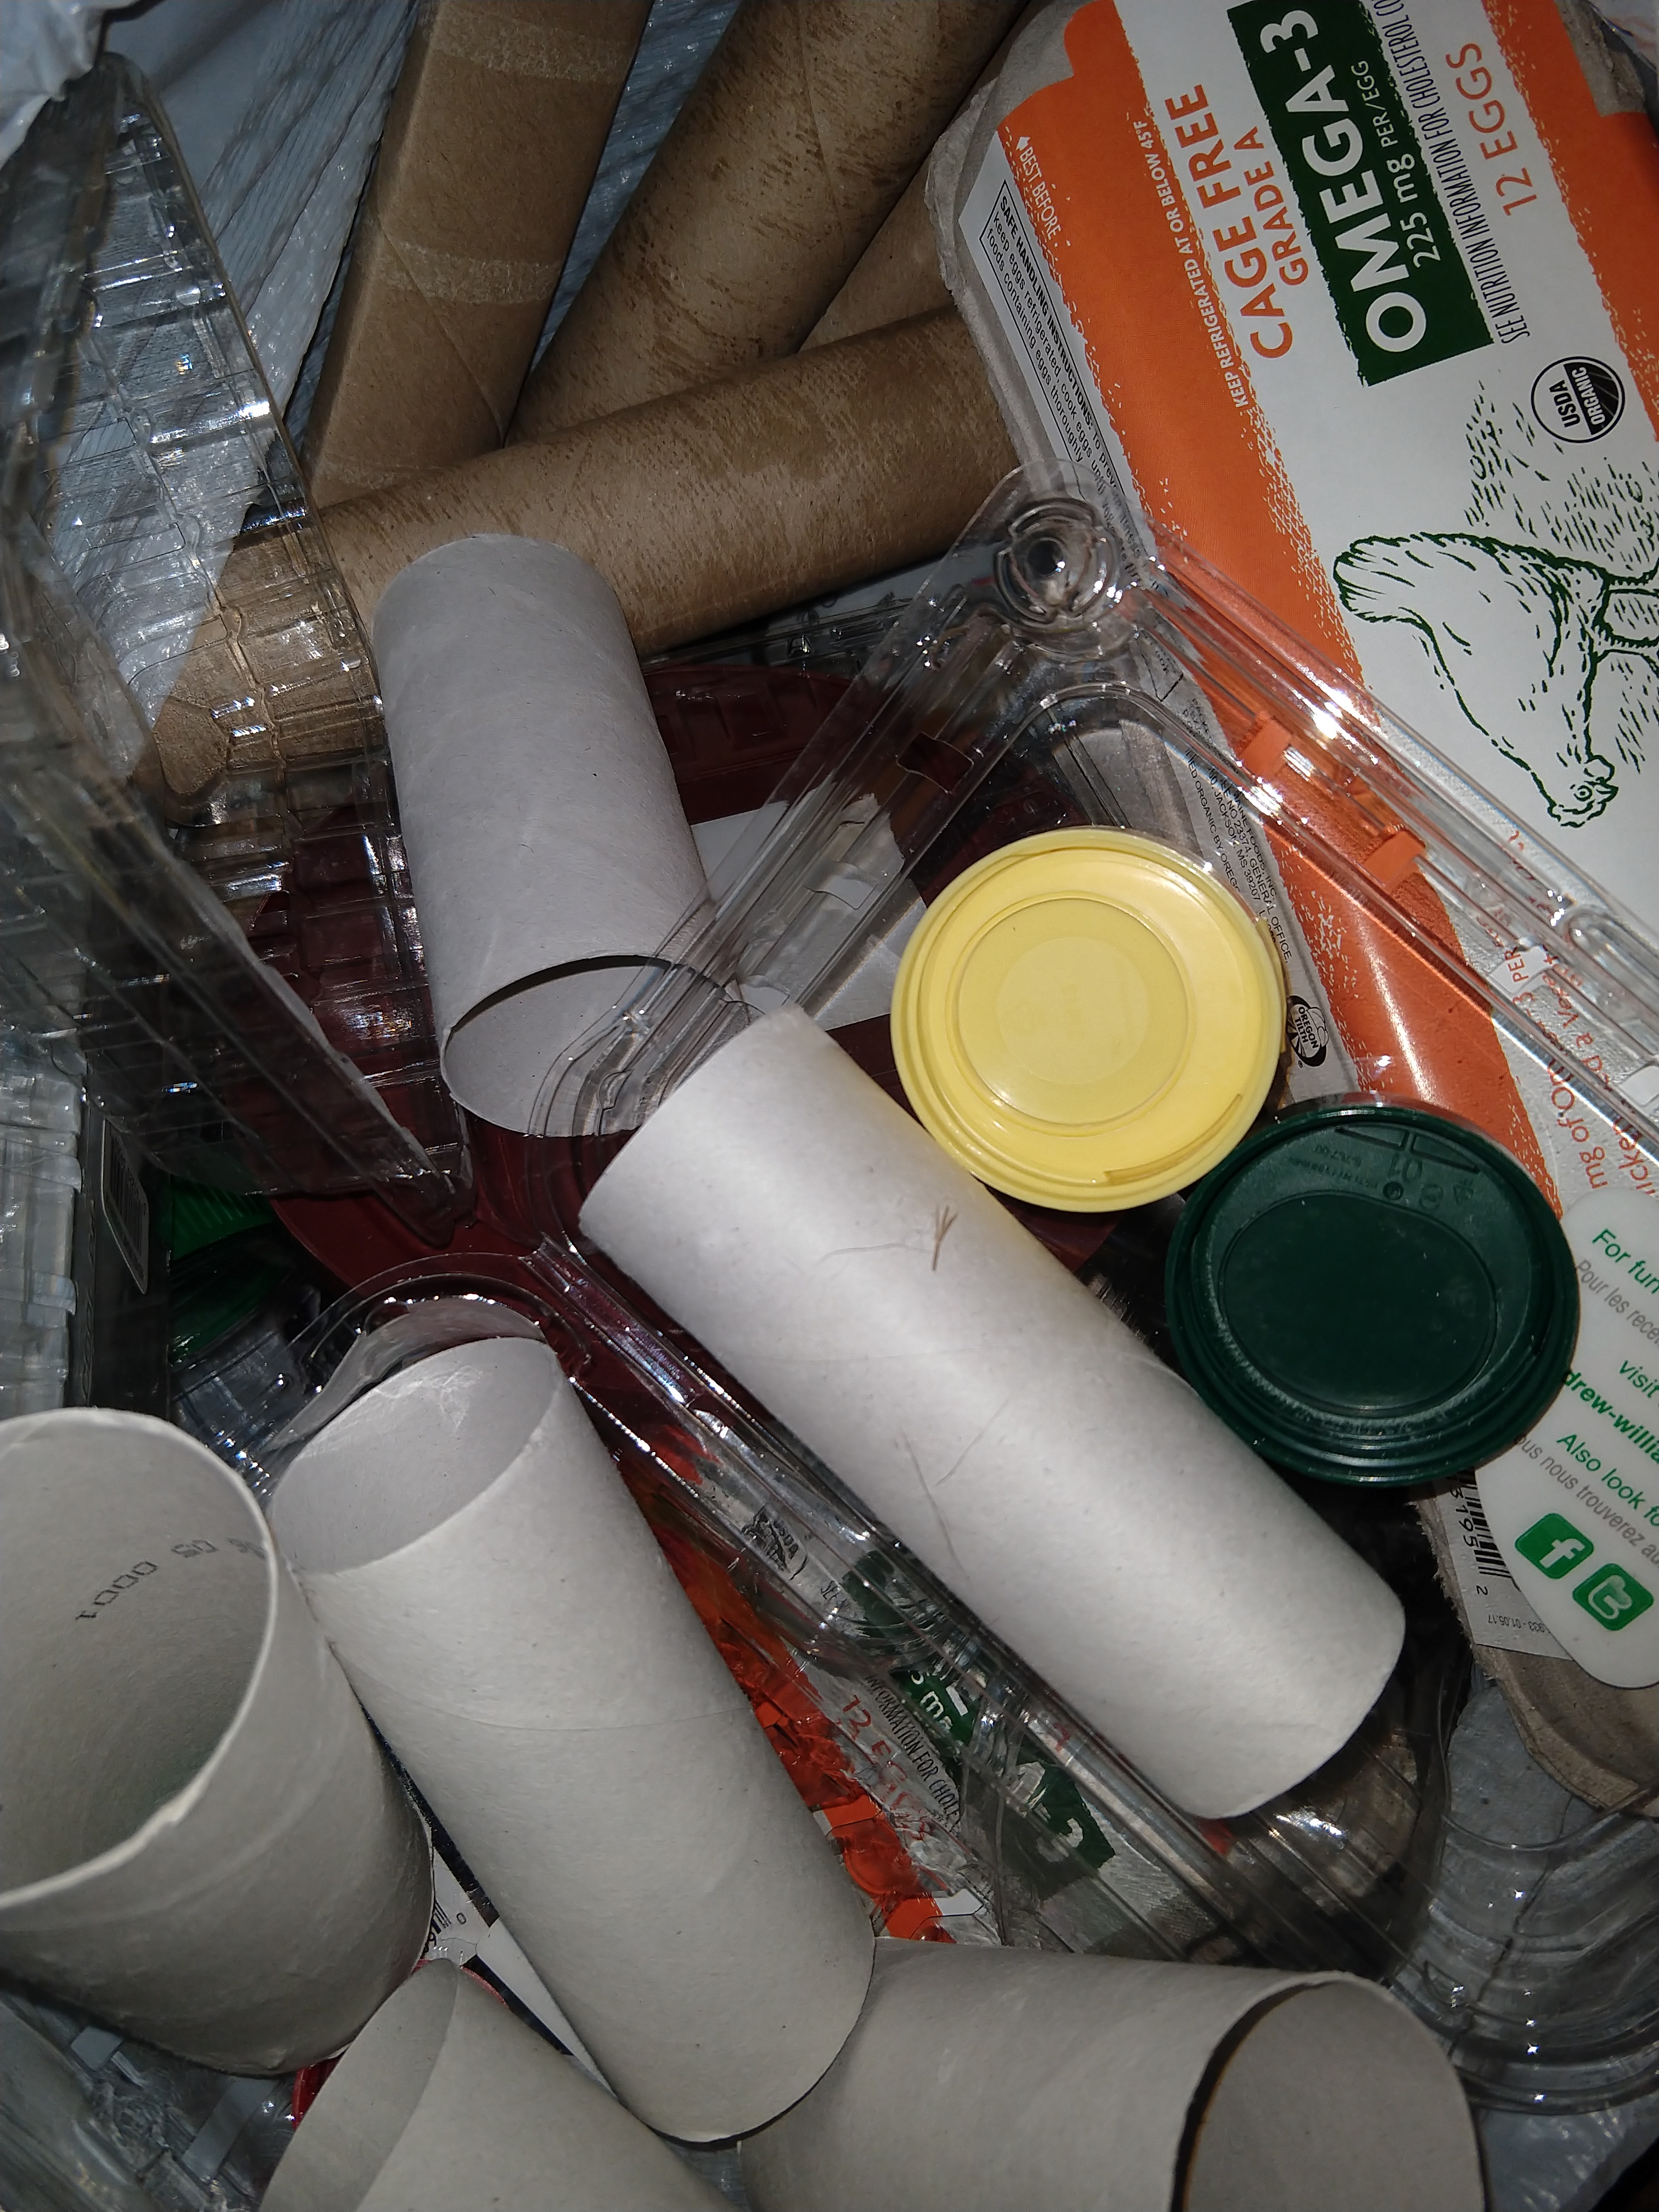
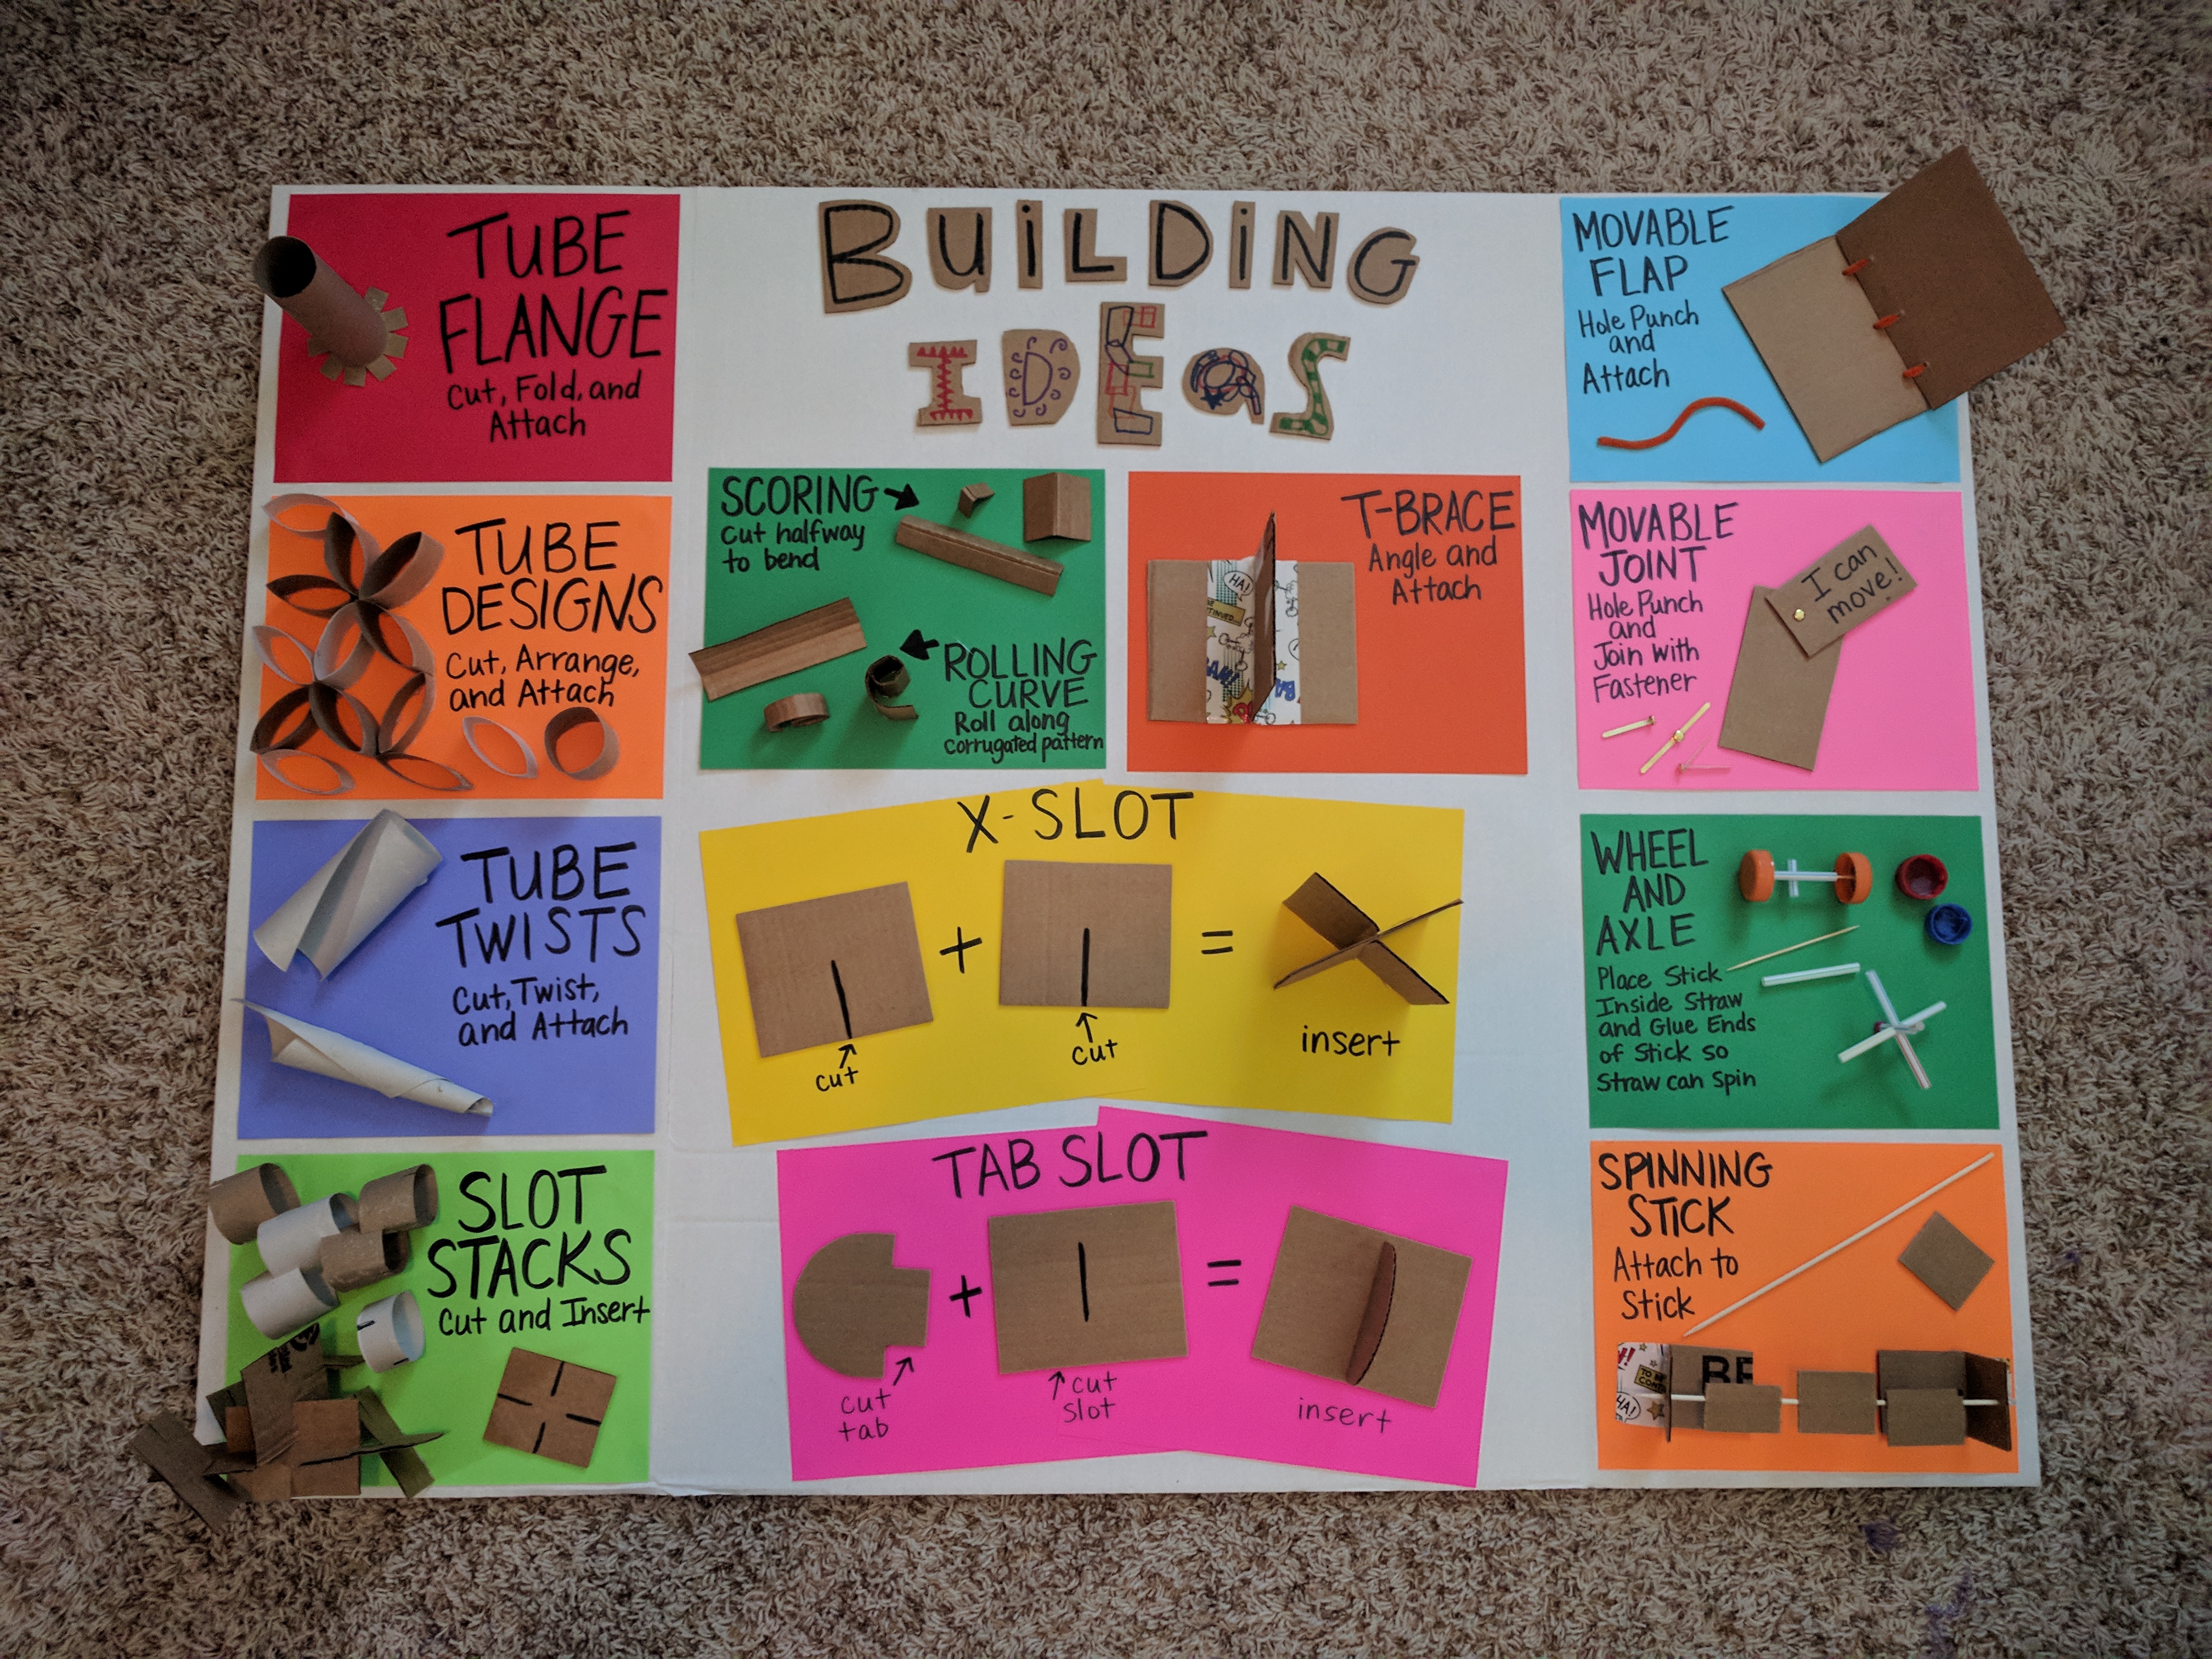
Figure 7. Examples of recyclable materials and suggestions for simple building ideas
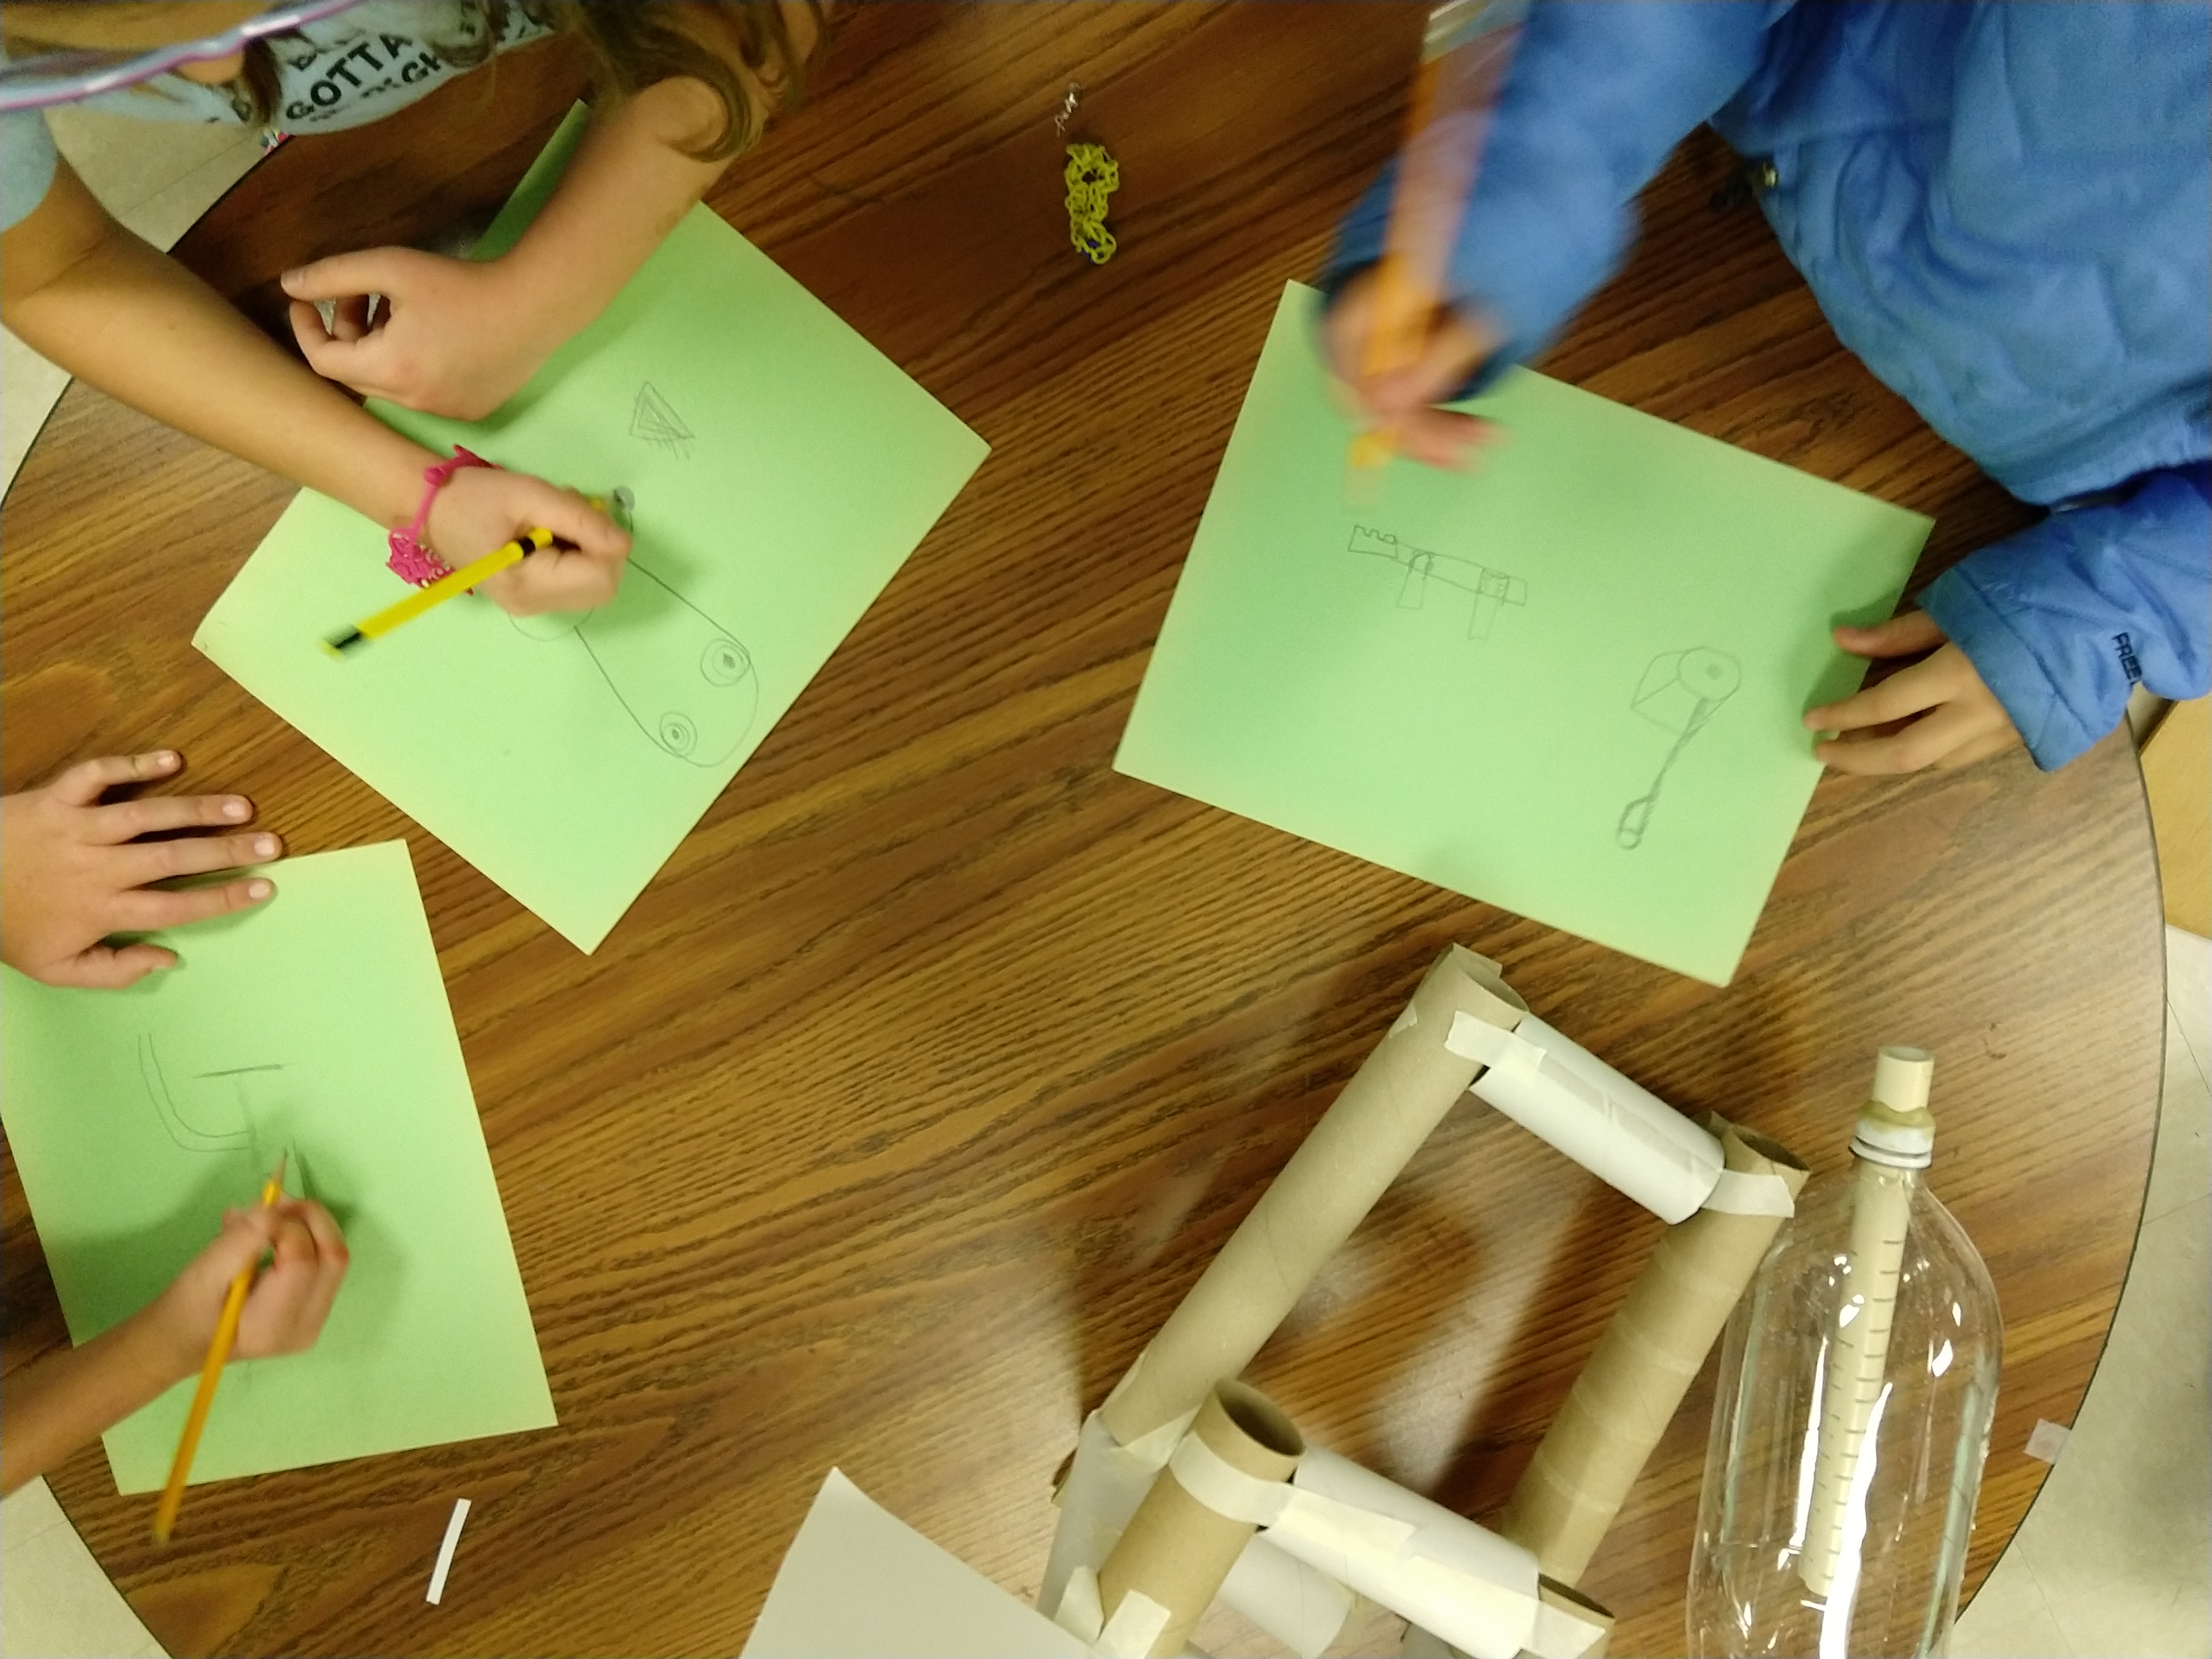
Lastly, the new self-directed makerspace service was tested with a small group of elementary students at the library. This involved the librarian selecting 6 students to come in and use the space for 30 minutes without adult interaction. I observed the ways that the students interacted with each station throughout the process, taking note of successes, struggles, and frustrations along the way (see Figure 8). Afterward, the librarian and I had a brief focus group with the elementary students to discuss their reactions, thinking, and suggestions. While all of the students were able to use the kits, task prompts, and craft materials on their own without adult supervision, 3/6 were confused about the sign-in/out procedures because they were in the same location. Additionally, all 6 students agreed that the original reflection sheet seemed like “boring work” and was too long for the students to complete within the time limit (average time to complete was 9 minutes).
Evolution
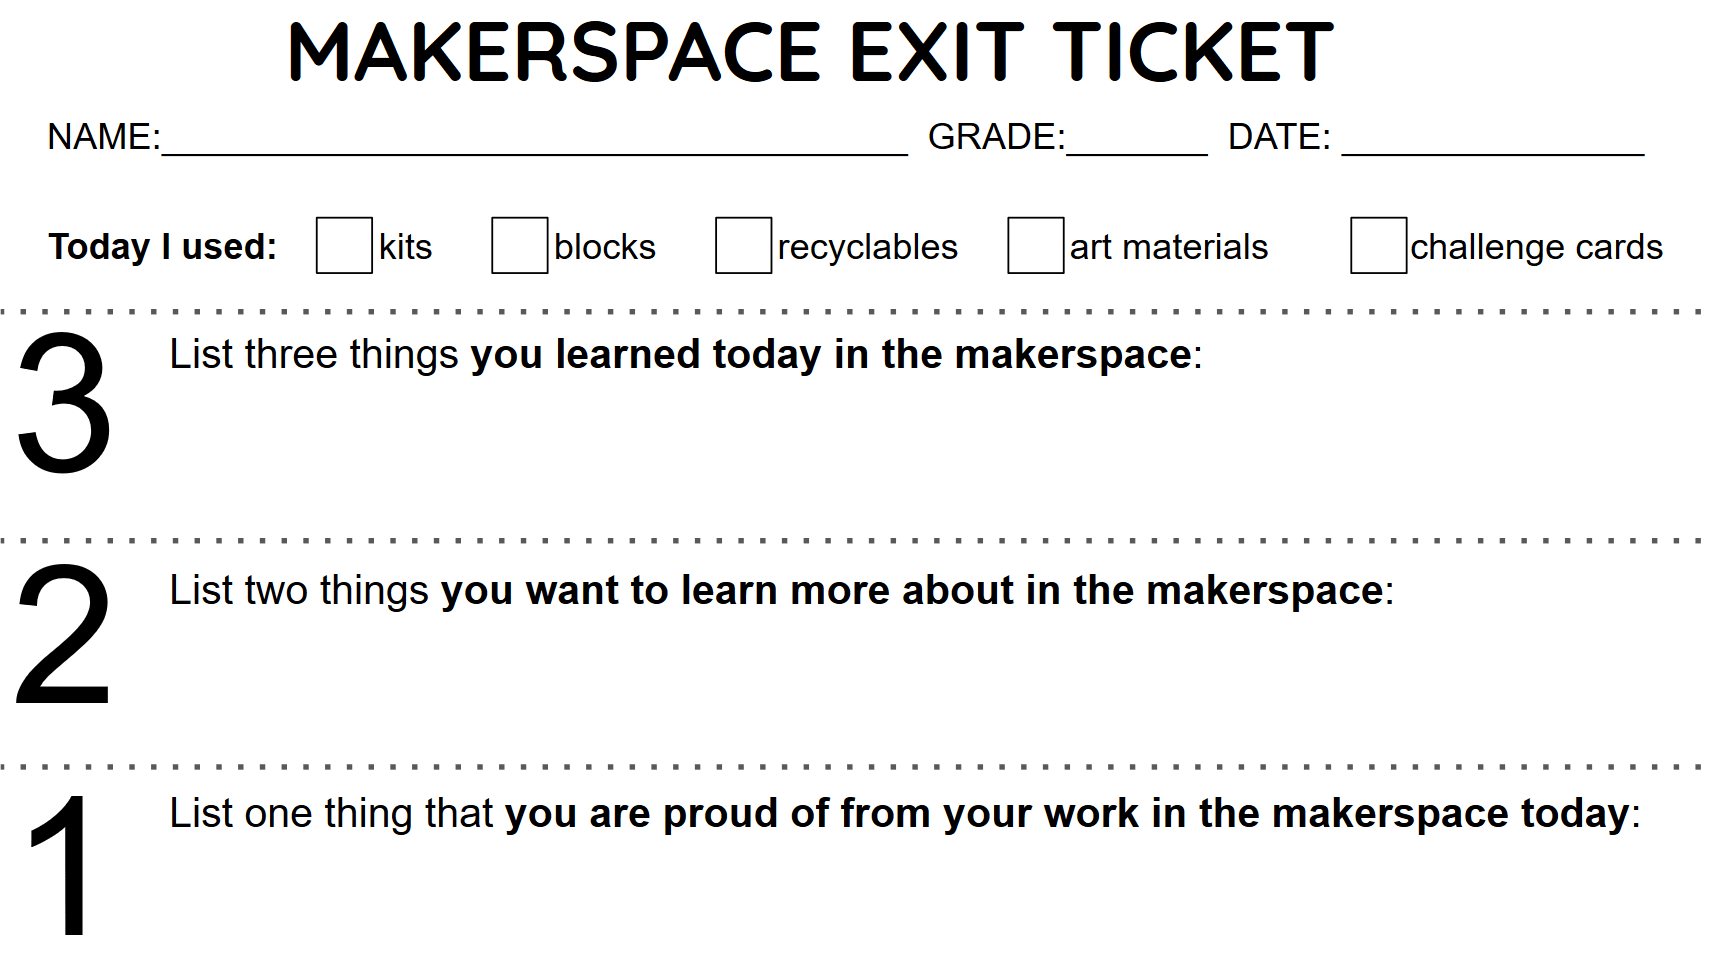
For the evolution of the space, we modified the procedures to bring the experience a more natural start to finish flow by providing a separate basket to turn in used timers and completed reflections at the far right of the space. Secondly, we created a shorter “exit ticket” style reflection sheet that was quicker for students to complete (average time to complete was 2 minutes, which was a 78% reduction). Additionally, this new exit ticket format was easier for a library volunteer to scan at the end of each day to send digital copies to the students’ teachers for accountability (see Figure 9). The original reflection sheet was still available for teachers who wished to assign an extra writing-intensive reflection to their students outside of the designated time in the makerspace.
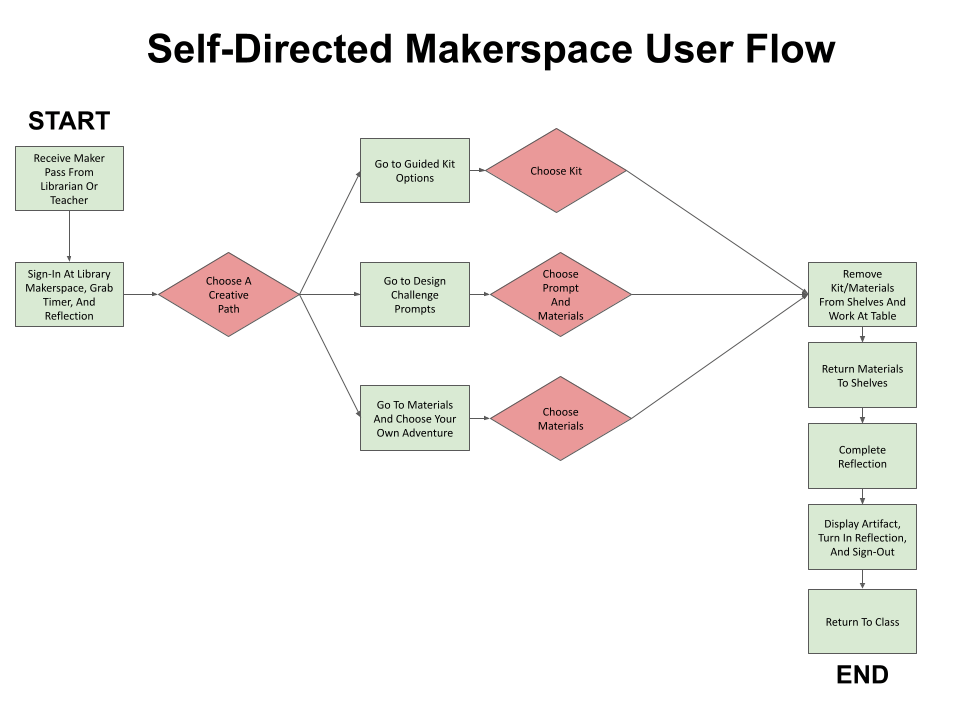
Lastly, a final user flow was created to illustrate an overview of the improved user journey (see Figure 10).
Impact
After implementing the new service design, the library saw a 68% reduction in safety incidents, dropping from 25 to just 8 minor incidents over a semester. This new, lower rate of incidents aligned with the safety record of the library before the original makerspace was introduced.
Additionally, the average time to complete the reflective exit ticket decreased by 78%, from 9 minutes to just 2 minutes. This change gave students more time for creative work while still completing the required documentation for their classroom teachers.
Together, these metrics demonstrated that the new self-service elementary library makerspace was both safe and highly effective at increasing student engagement in classroom-related learning.
