Project overview
Problem
Our team was asked to create a digital product that helps people achieve better mental health during the COVID-19 pandemic and beyond. We targeted self-described “busy people” with the prevailing mindset being “if it’s not on my calendar, it’s not going to happen.”
Method
The project lasted six weeks and included three research phases. First, we used remote moderated interviews to uncover several obstacles for establishing the habit of mindful meditation. Second, we facilitated rapid experimentation using low-fidelity storyboarding concept testing. Third, we facilitated rapid experimentation using concierge test with our high-fidelity prototype meditation app and 7-day diary study (see Figure 1). Throughout the project our team used a variety of tools, including Mural for collaborative planning, Google Forms and Sheets for data collection and analysis, Invision of prototyping, and Zoom for moderated virtual interviews.
Impact
Our team discovered that integrating a calendar sync feature into the meditation app directly improved the user experience, leading to a 9-minute increase in the average meditation time.
My role
As a member of the 5-person team, I participated in all team sessions, including brainstorming, prioritization, planning, facilitation, analysis, and presentations. I facilitated research during the discovery phase (i.e., interviews) and the two rapid experimentation phases (i.e., storyboard concept testing and concierge testing). Additionally, I completed descriptive analysis of the rapid experimentation diary study, including the creation of charts for reporting and presentation.
Process Details
Discovery research
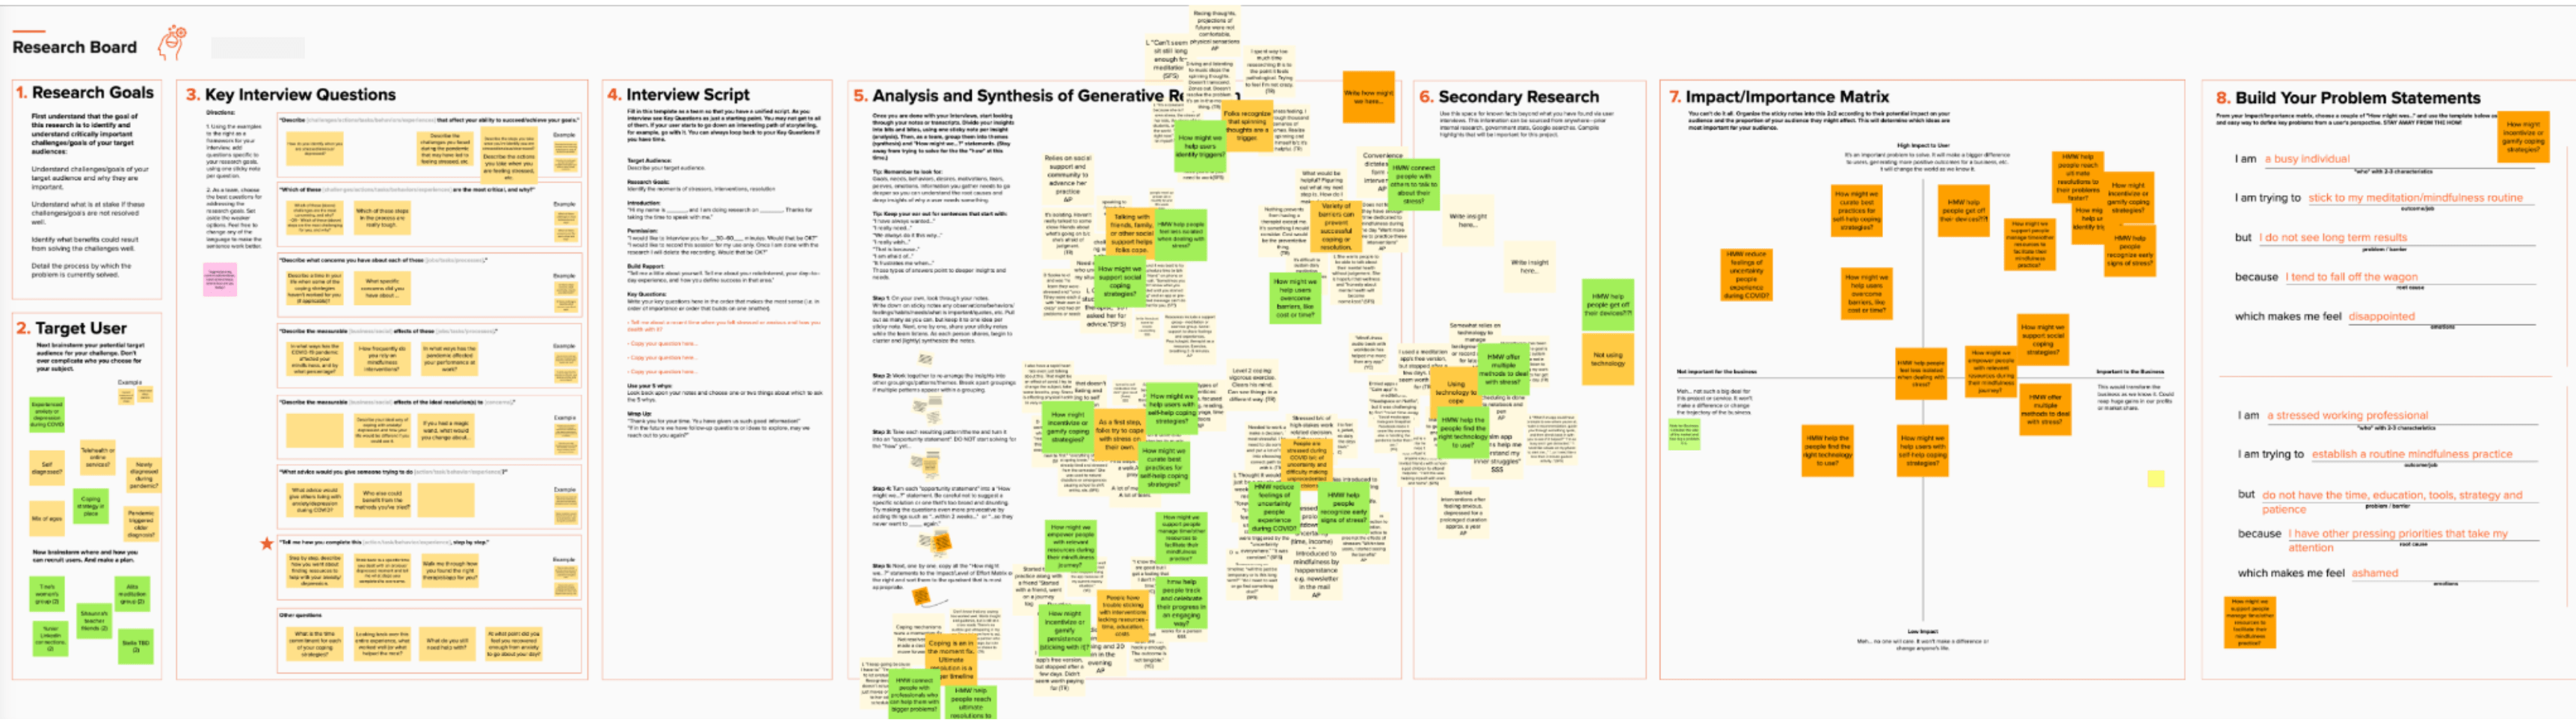
Our team used Mural to plan our discovery research (see Figure 2). First we collaboratively identified our target users and wrote interview questions. 30-minute moderated interviews were conducted with 10 participants and then analyze using affinity mapping, which generated How Might We (HMW) questions. Secondary desk research was used to explore HMWs, such as “HMW help users overcome barriers of time?” A matrix was used to identify the impact and importance of key findings/ideas. Lastly, we used our discovery data to build problem statements that we could use to guide our product thinking and concept development (i.e., I am a busy individual who is trying to stick to my mindfulness routine but I do not see long-term results because I tend to fall off the wagon, which makes me feel disappointed.).
Value stream
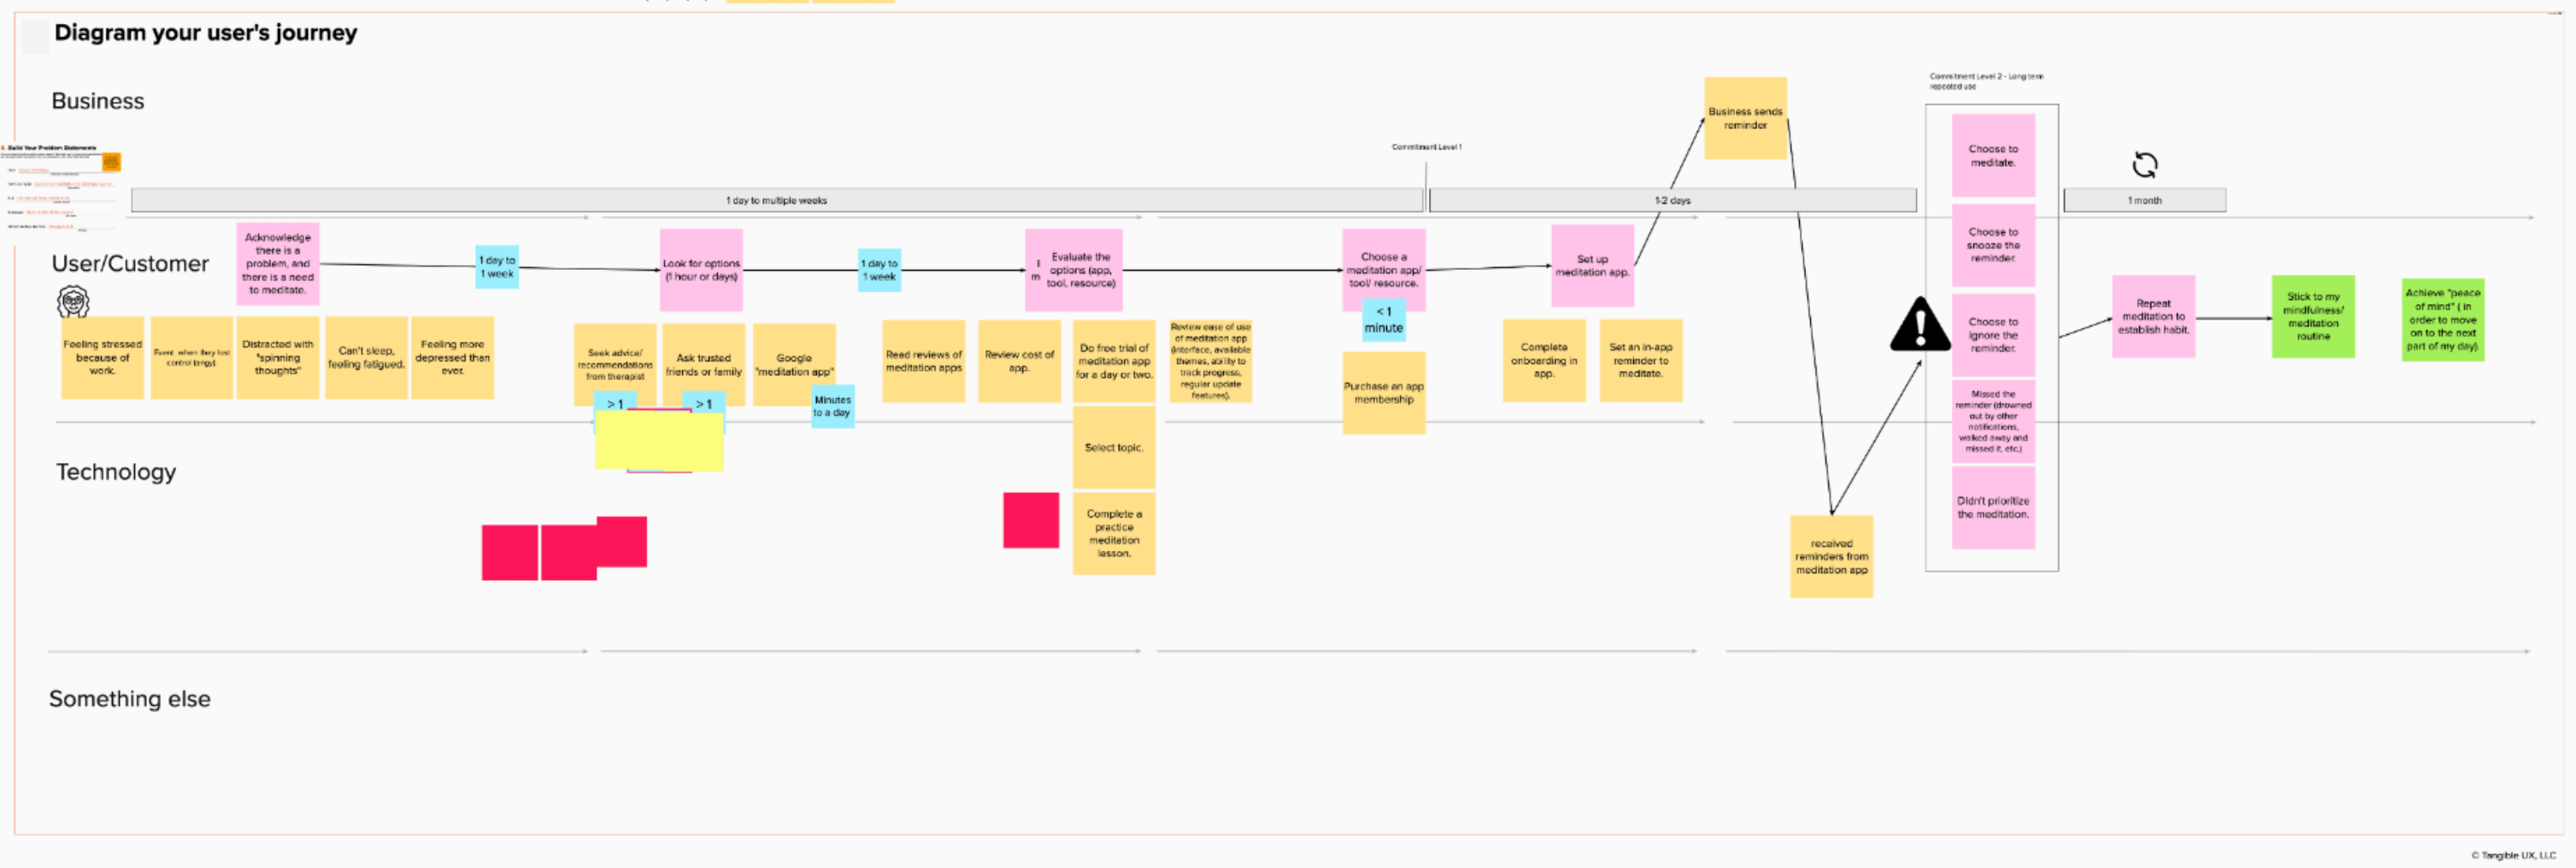
We continued to use Mural to help us translate our discovery research findings into a value-centered user journey diagram that included steps for business actions, user/customer actions, and technology implementation (see Figure 3).
Feature prioritization
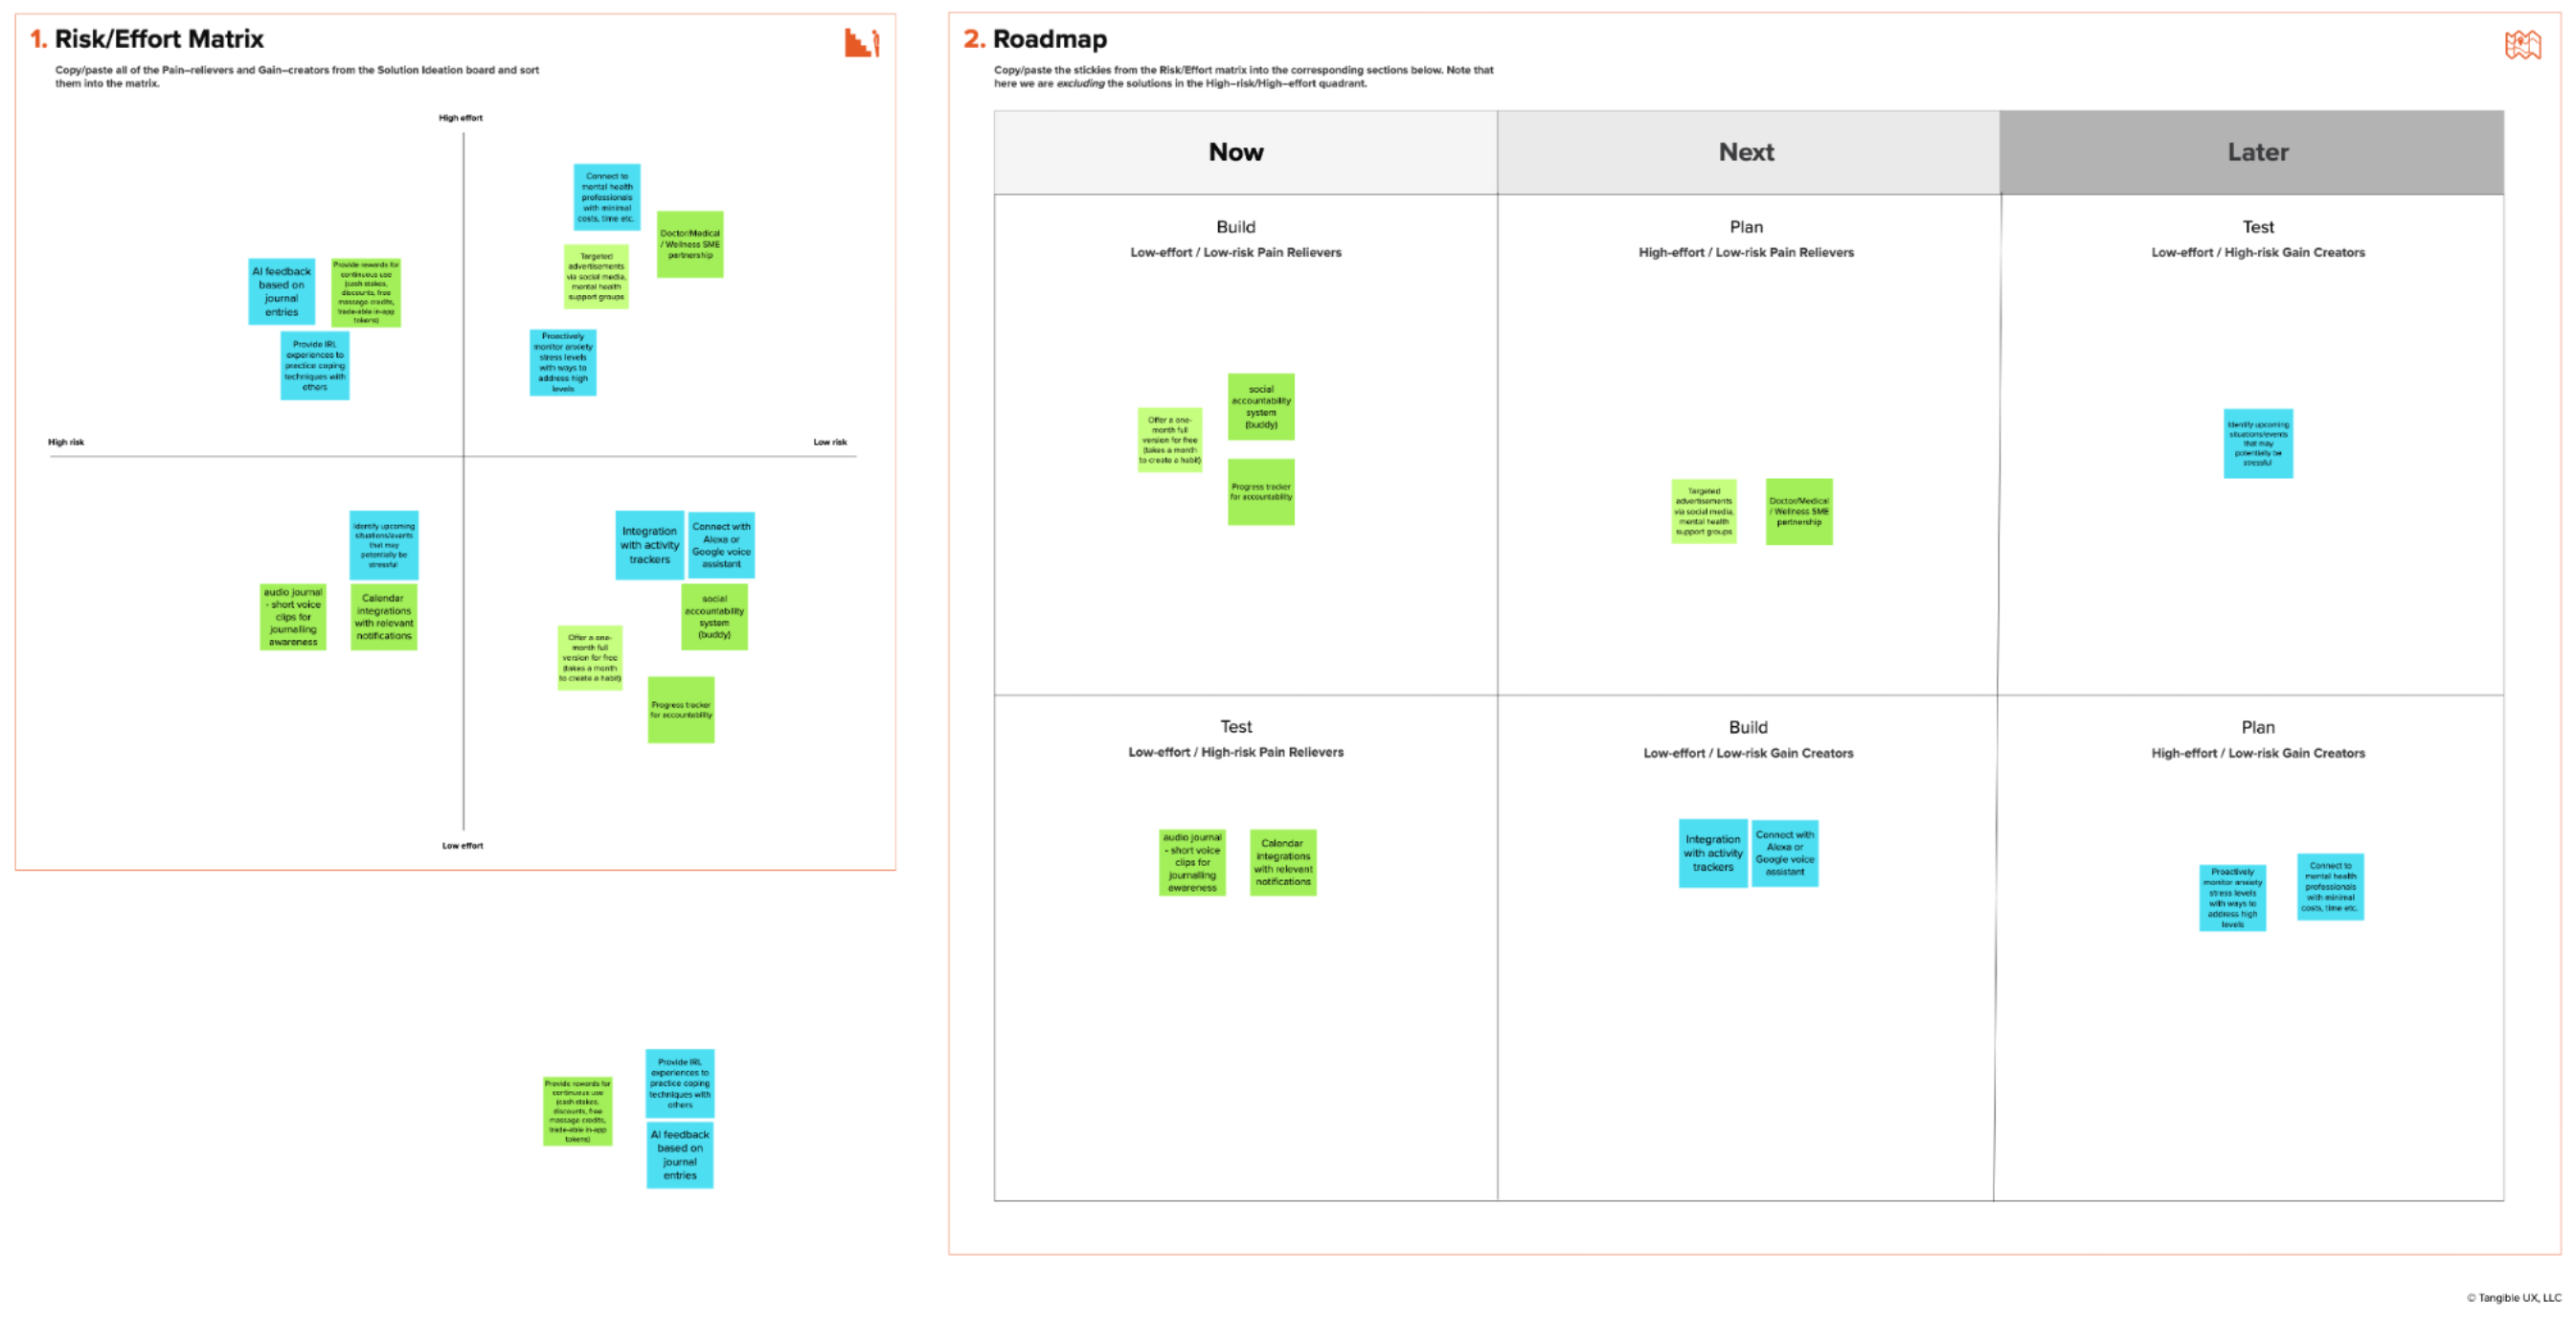
A prioritization matrix in Mural helped us identify the risk and effort for our pain-relievers and gain-creators, which were then prioritized in a roadmap to guide our rapid experiments (see Figure 4).
Rapid experimentation #1 with low-fidelity concept testing
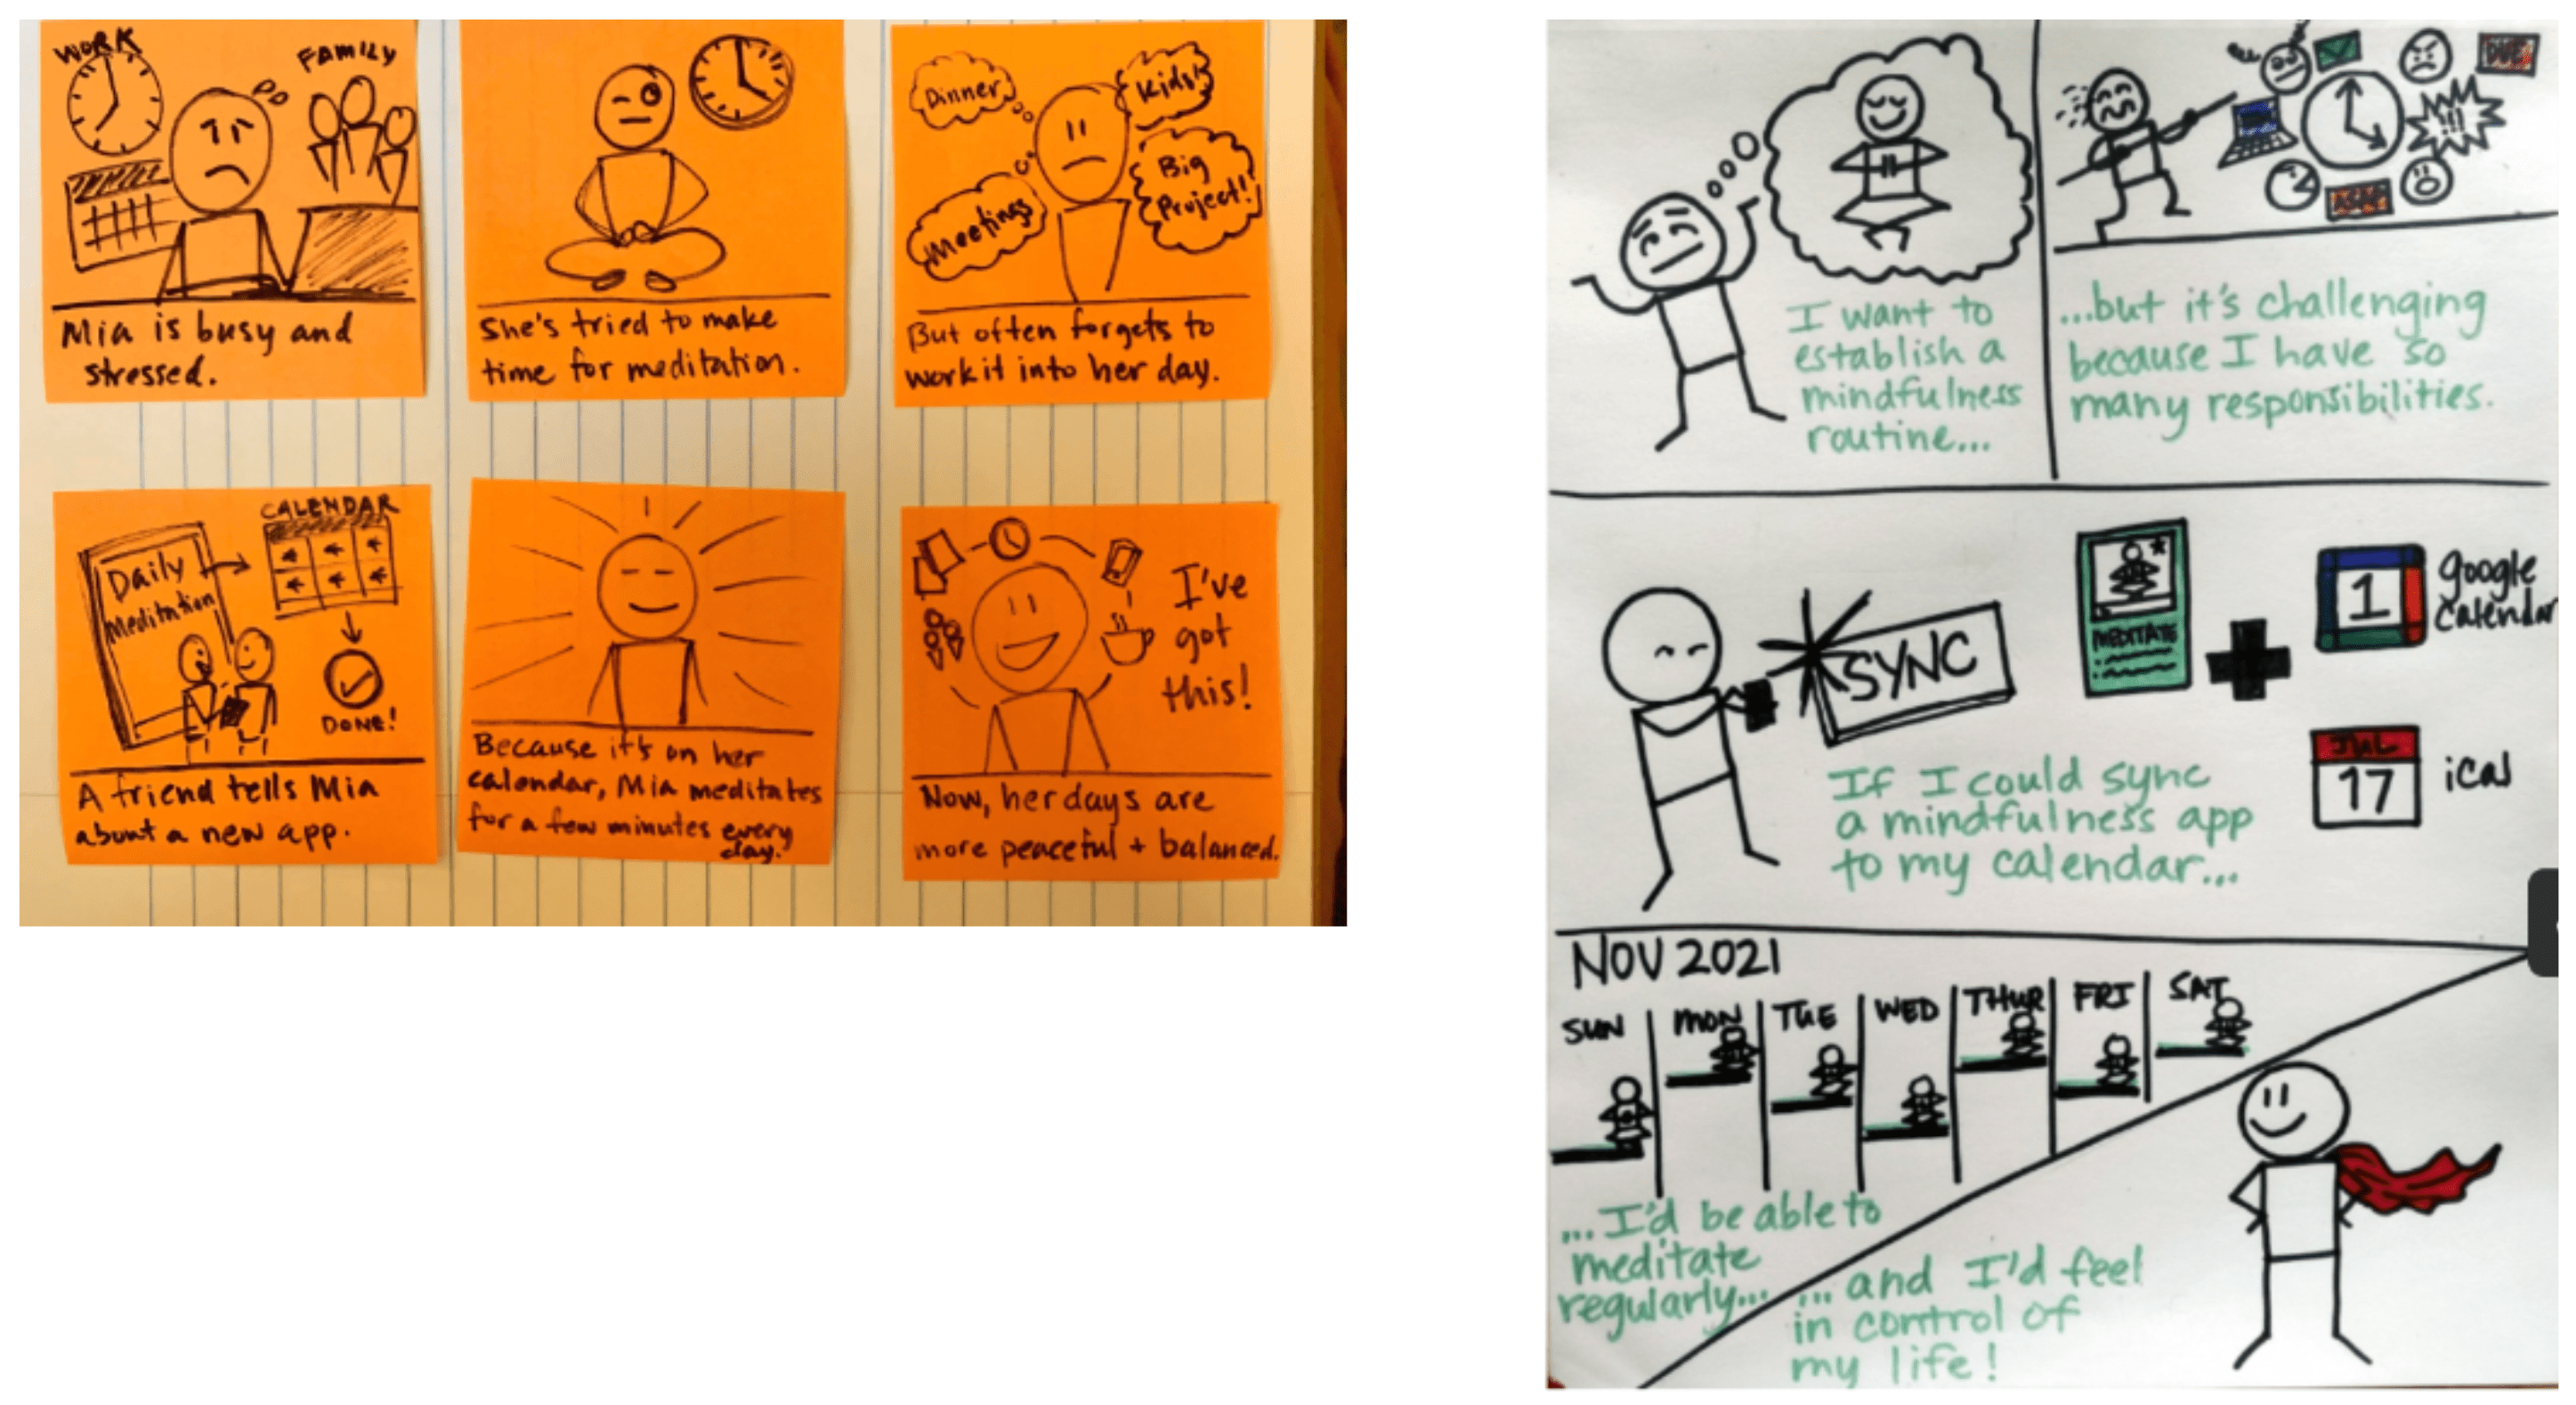
The first rapid experiment included a concept test using moderated interviews with seven participants, including discussion of low-fidelity storyboarding concepts to reduce “preciousness” and increase storytelling (see Figure 5). Questions included comparison ratings about current/past mediation app experiences compared to our low-fidelity storyboard concept.
Rapid experimentation #2 with concierge test, high-fidelity prototype, and diary study
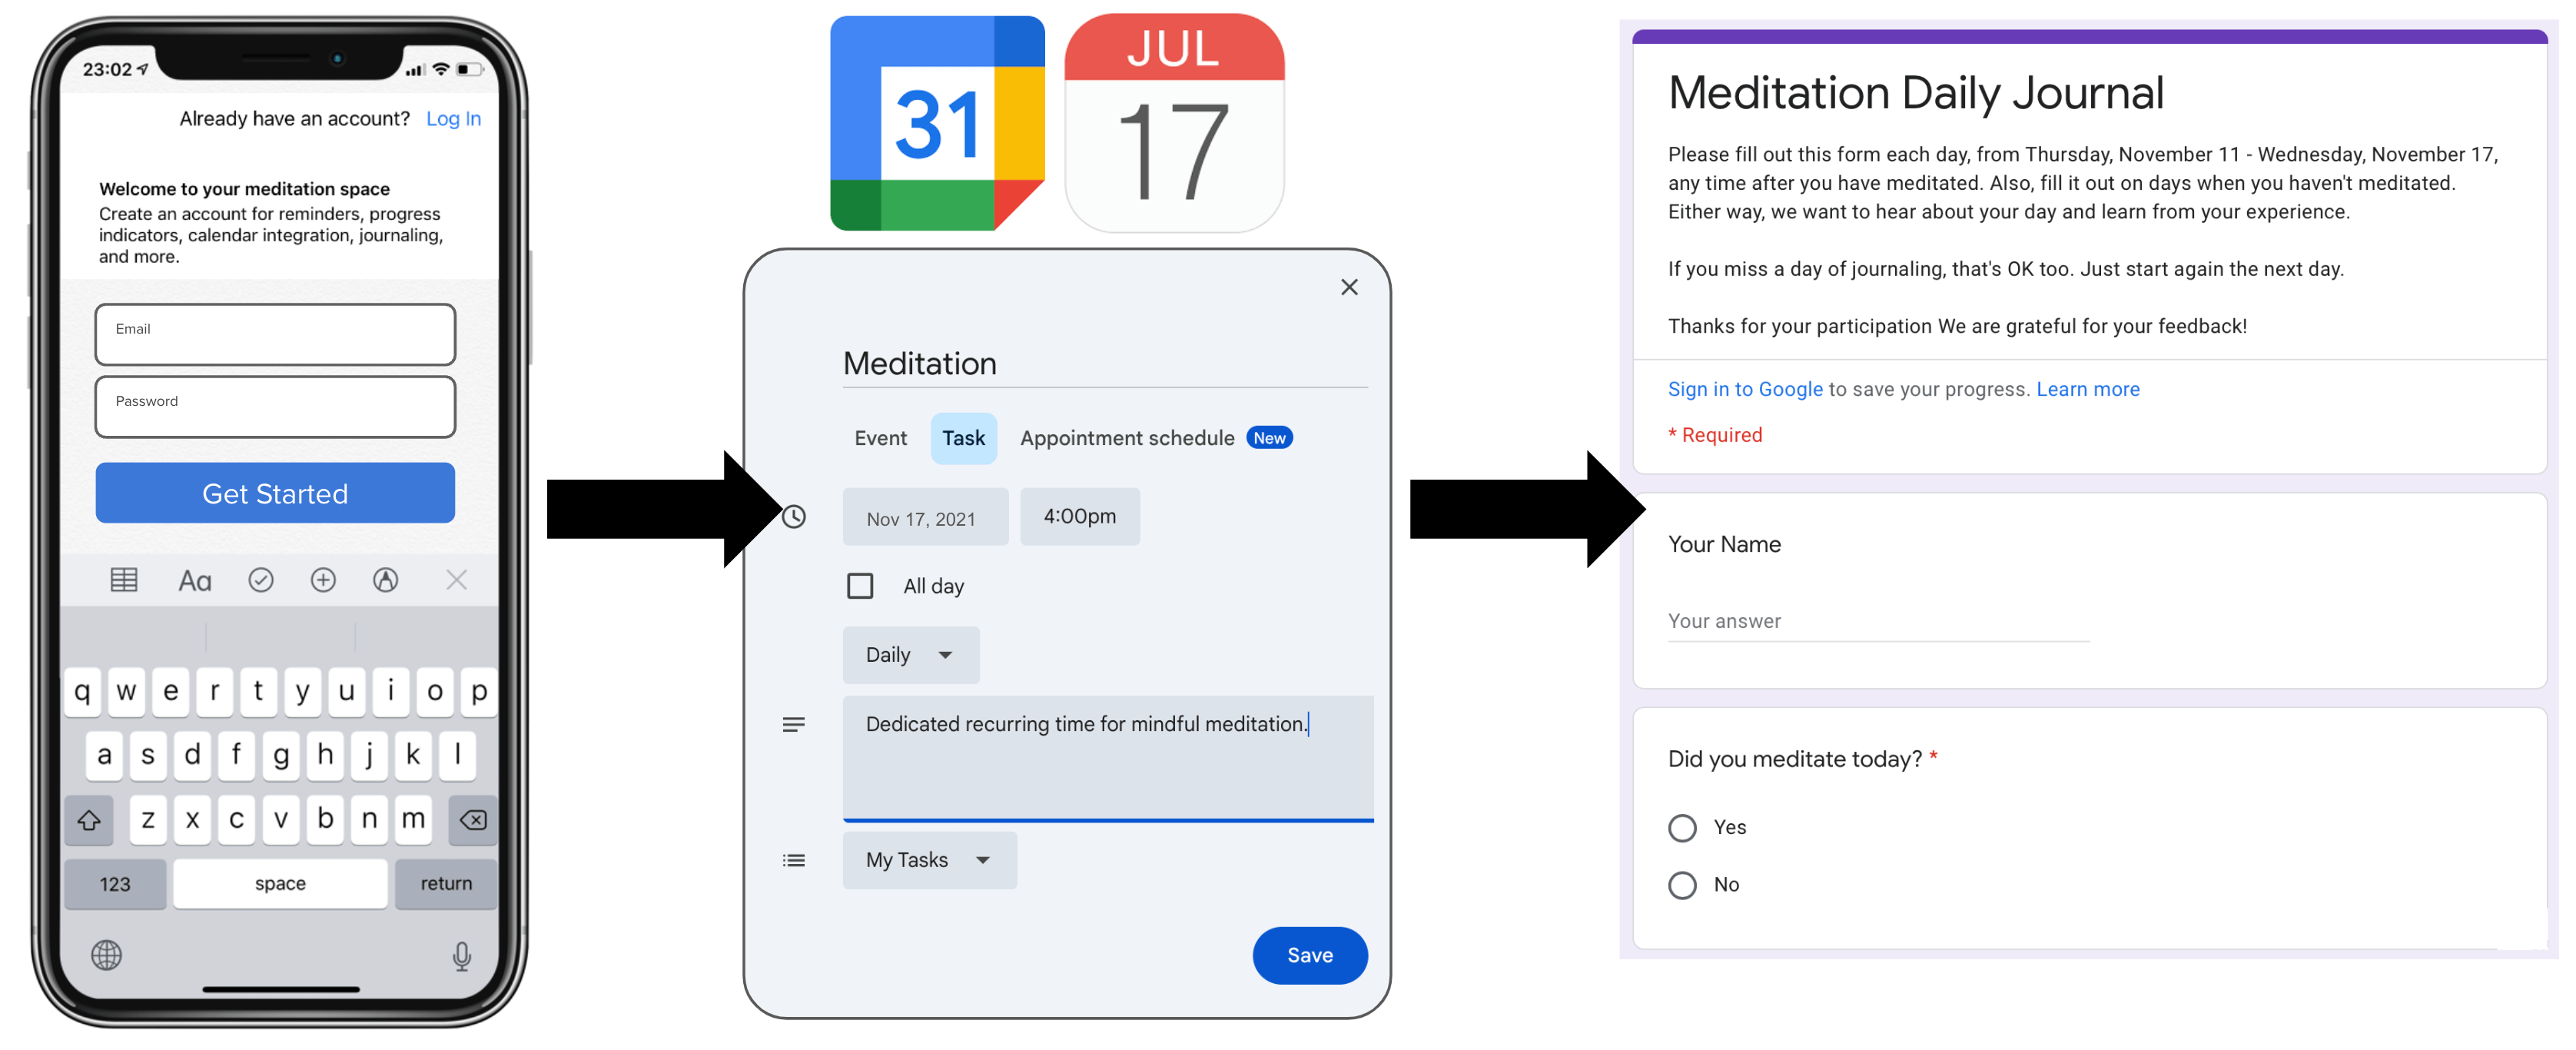
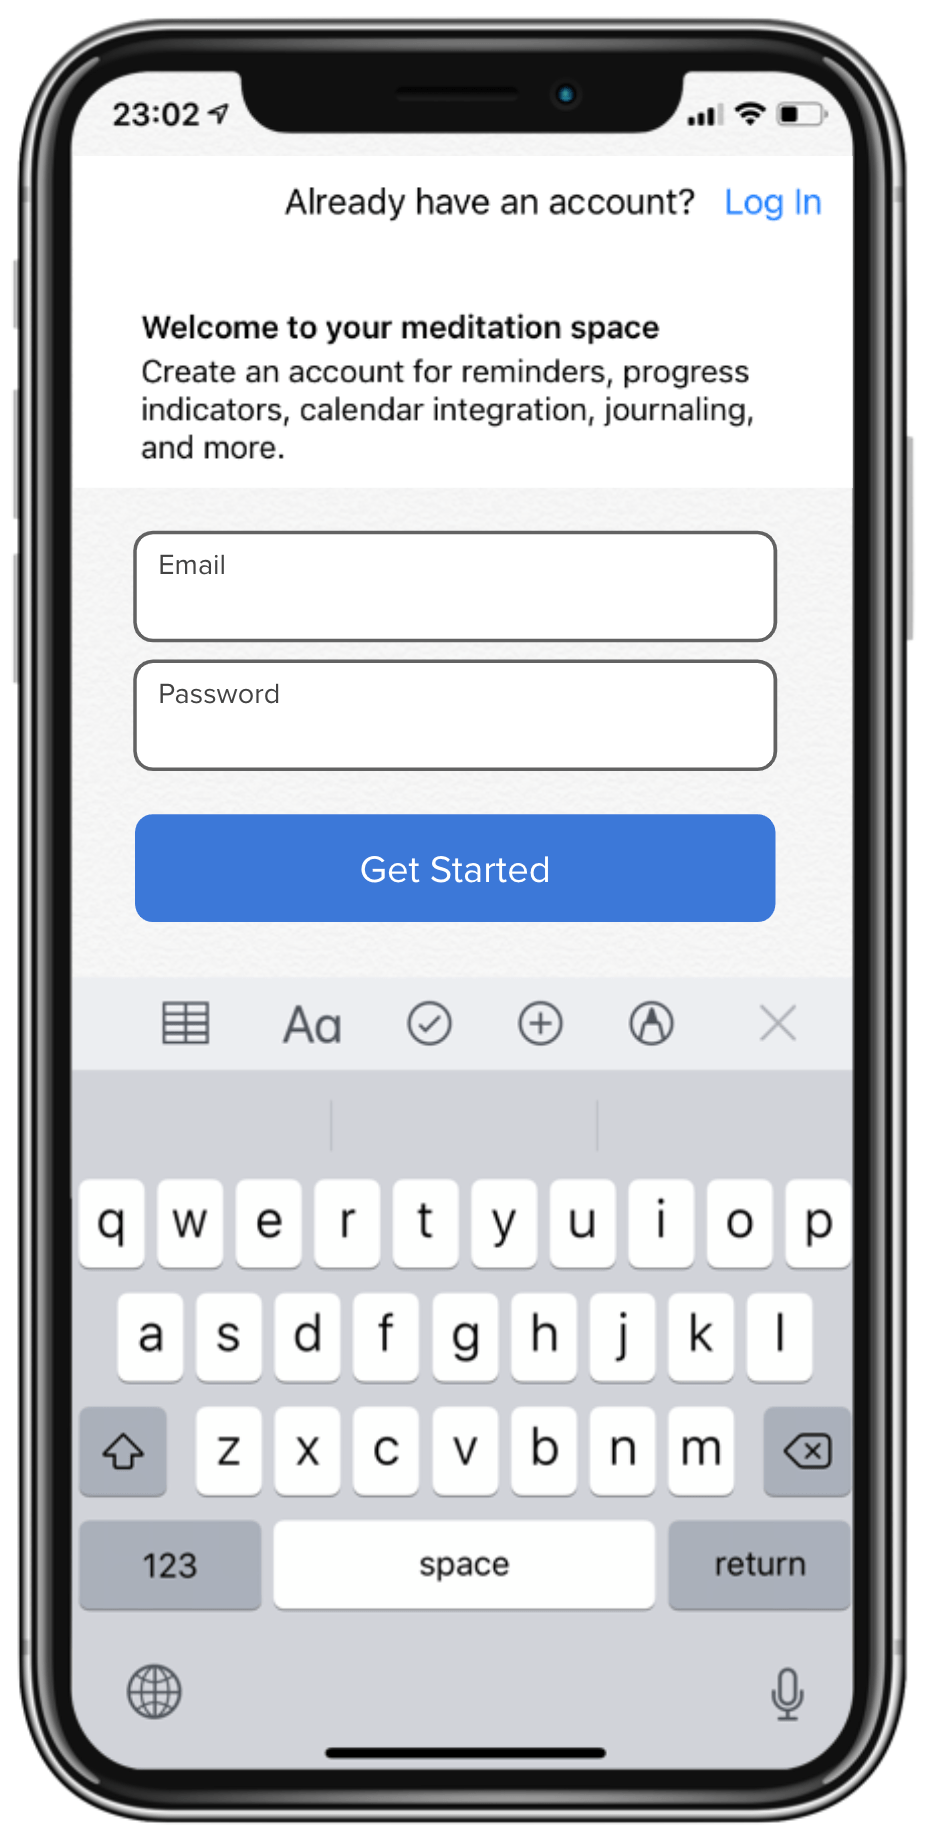
The second rapid experiment used a Concierge Test that included a high-fidelity Invision prototype (see Figure 6) coupled with a behind-the-scenes researcher who created a synched calendar event with the participants’ own calendar based on the choices they made in the high-fidelity prototype. This was immediately followed by a 7-day diary study that used a Google Form.
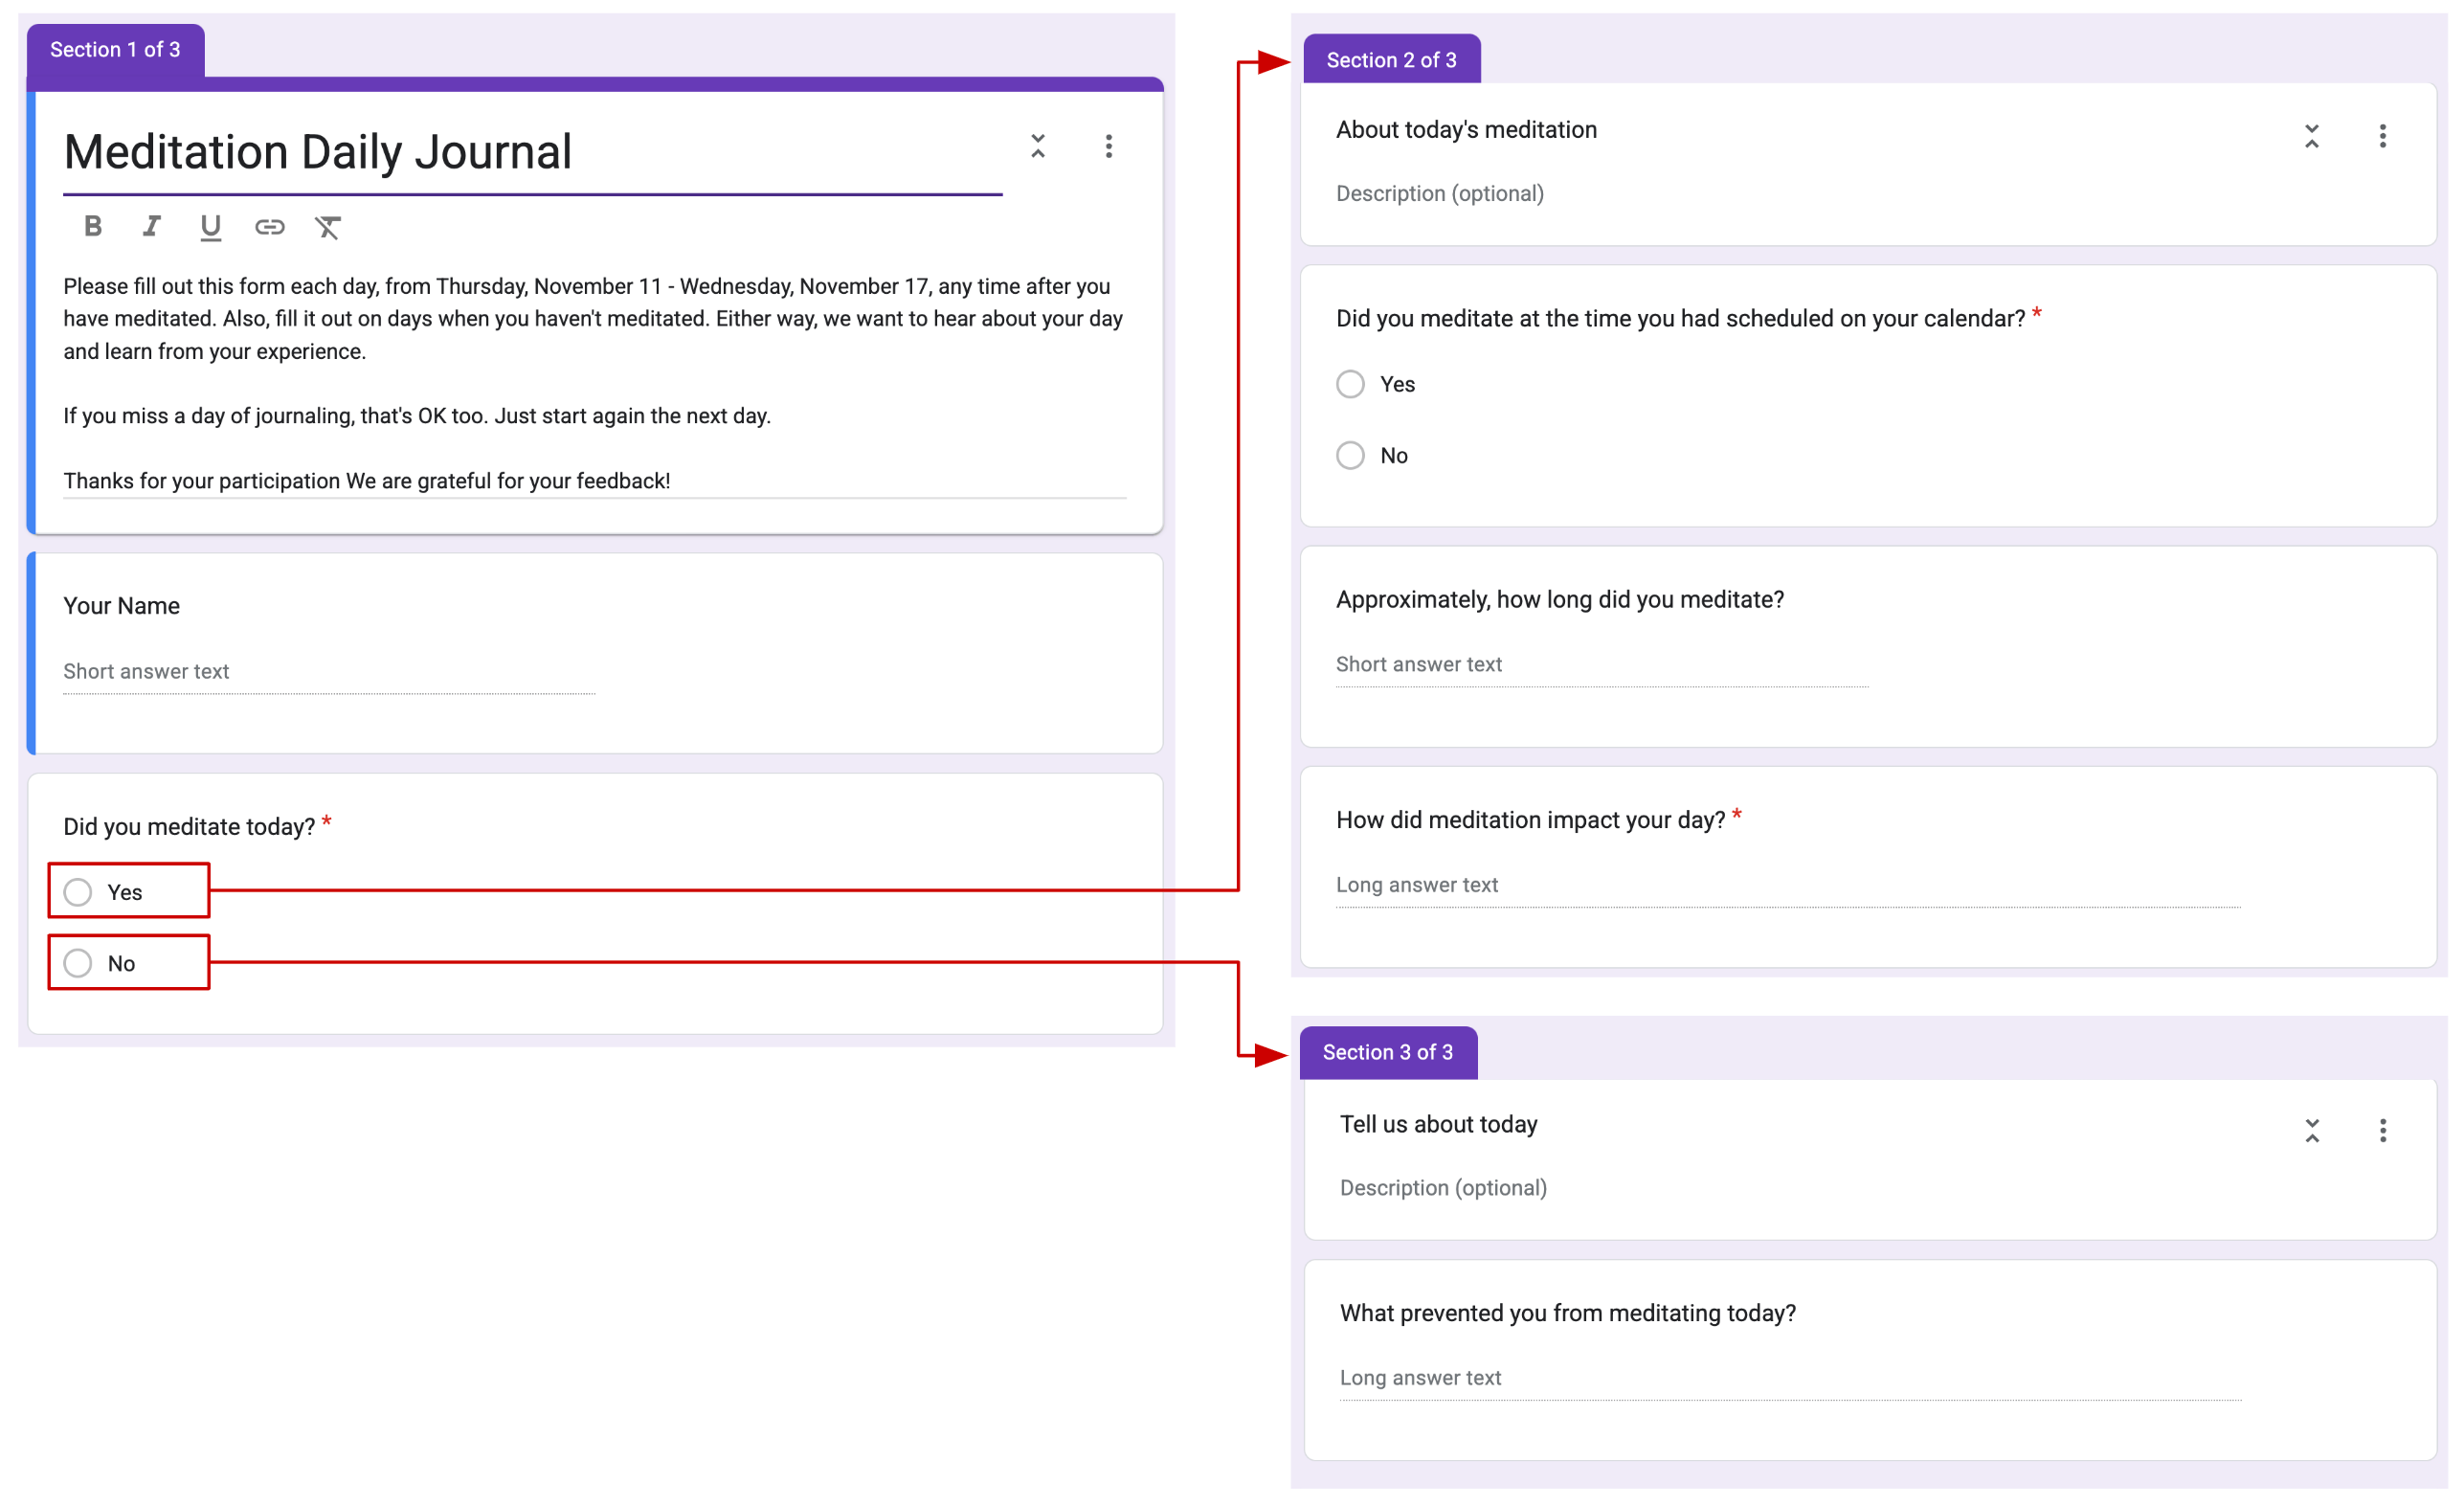
The diary study used a Google Form with conditional logic (see Figure 7). If participants answered “Yes” to the question “Did you meditate today?” the form took them to questions about their completed meditation, including one closed-ended question and three open-ended questions. If participants answered “No” to the question “Did you meditate today?” the form took them to one closed-ended question and one open-ended question so that we could learn a little more about why they did not complete a meditation session that day.
Data from the diary study was analyzed using descriptive statistics in Google Sheets (see Figure 8).
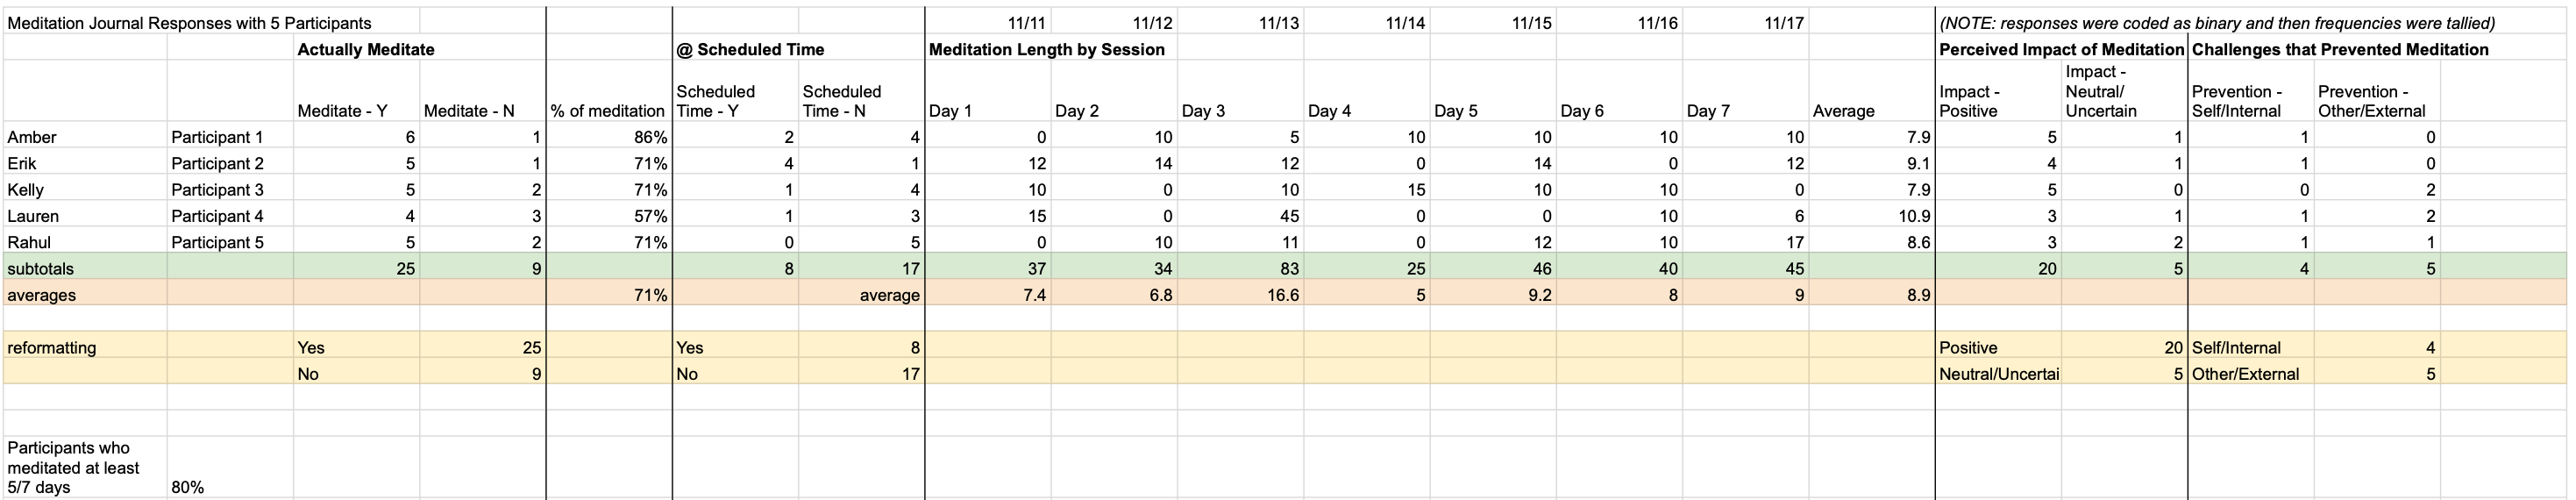
Figure 8. Diary study data analysis in Google Sheets
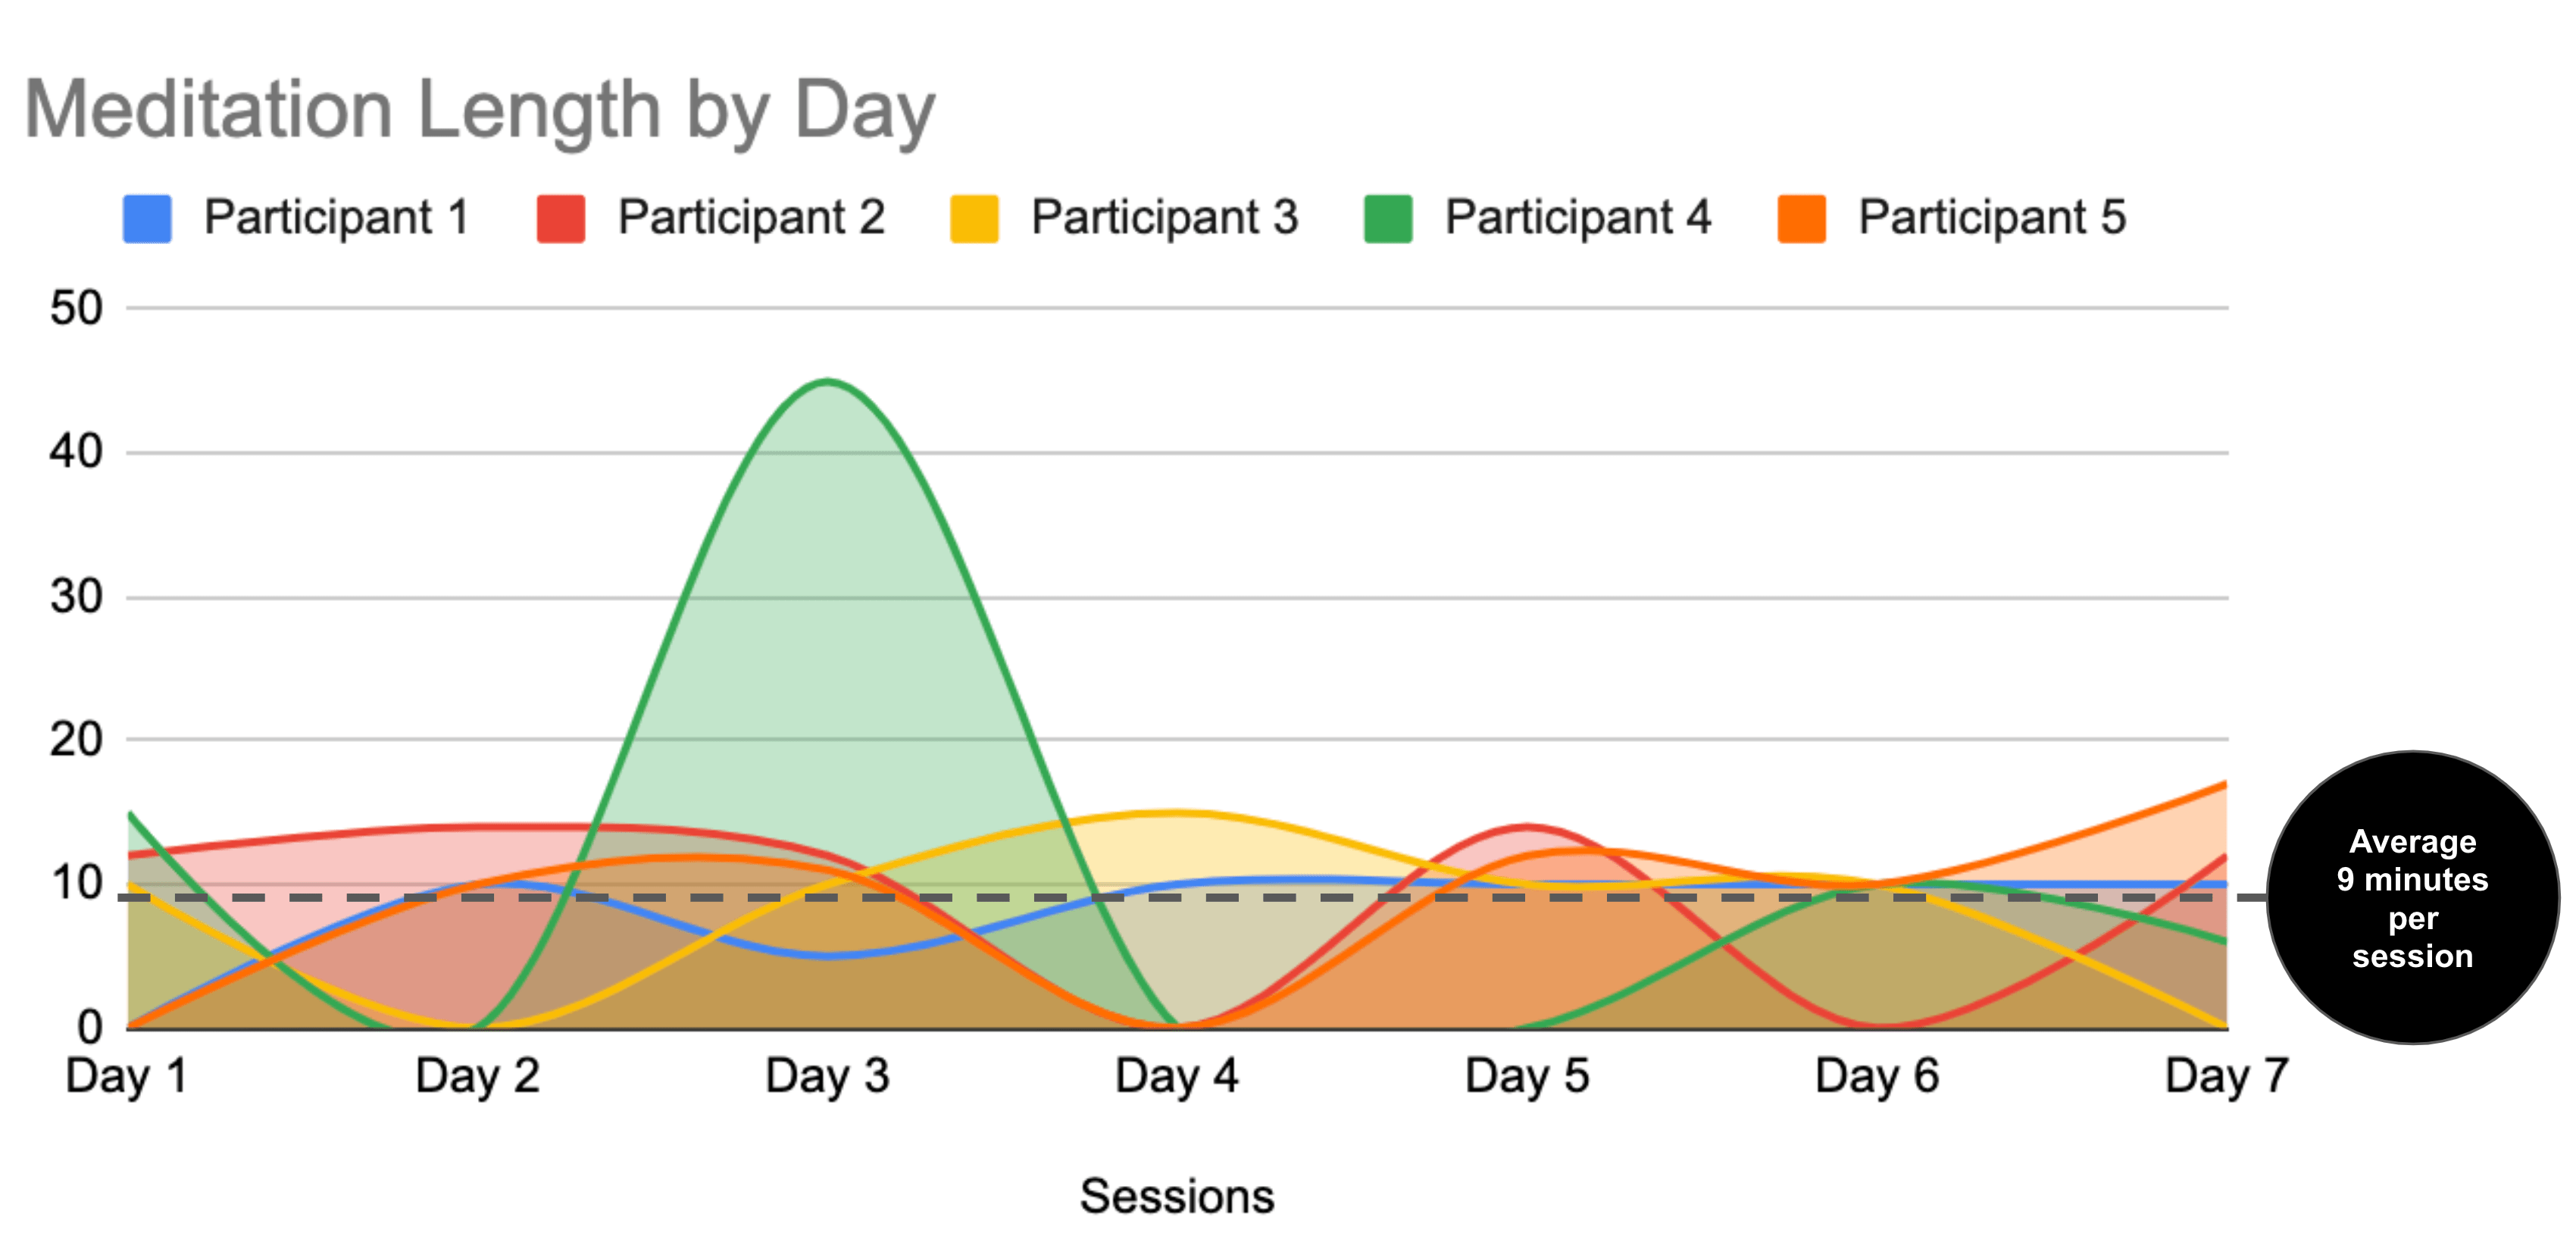
Findings highlighted that participants averaged 9 minutes per session, which was considered great for a group of self-described busy individuals who were struggling to establish a habit (see Figure 9).
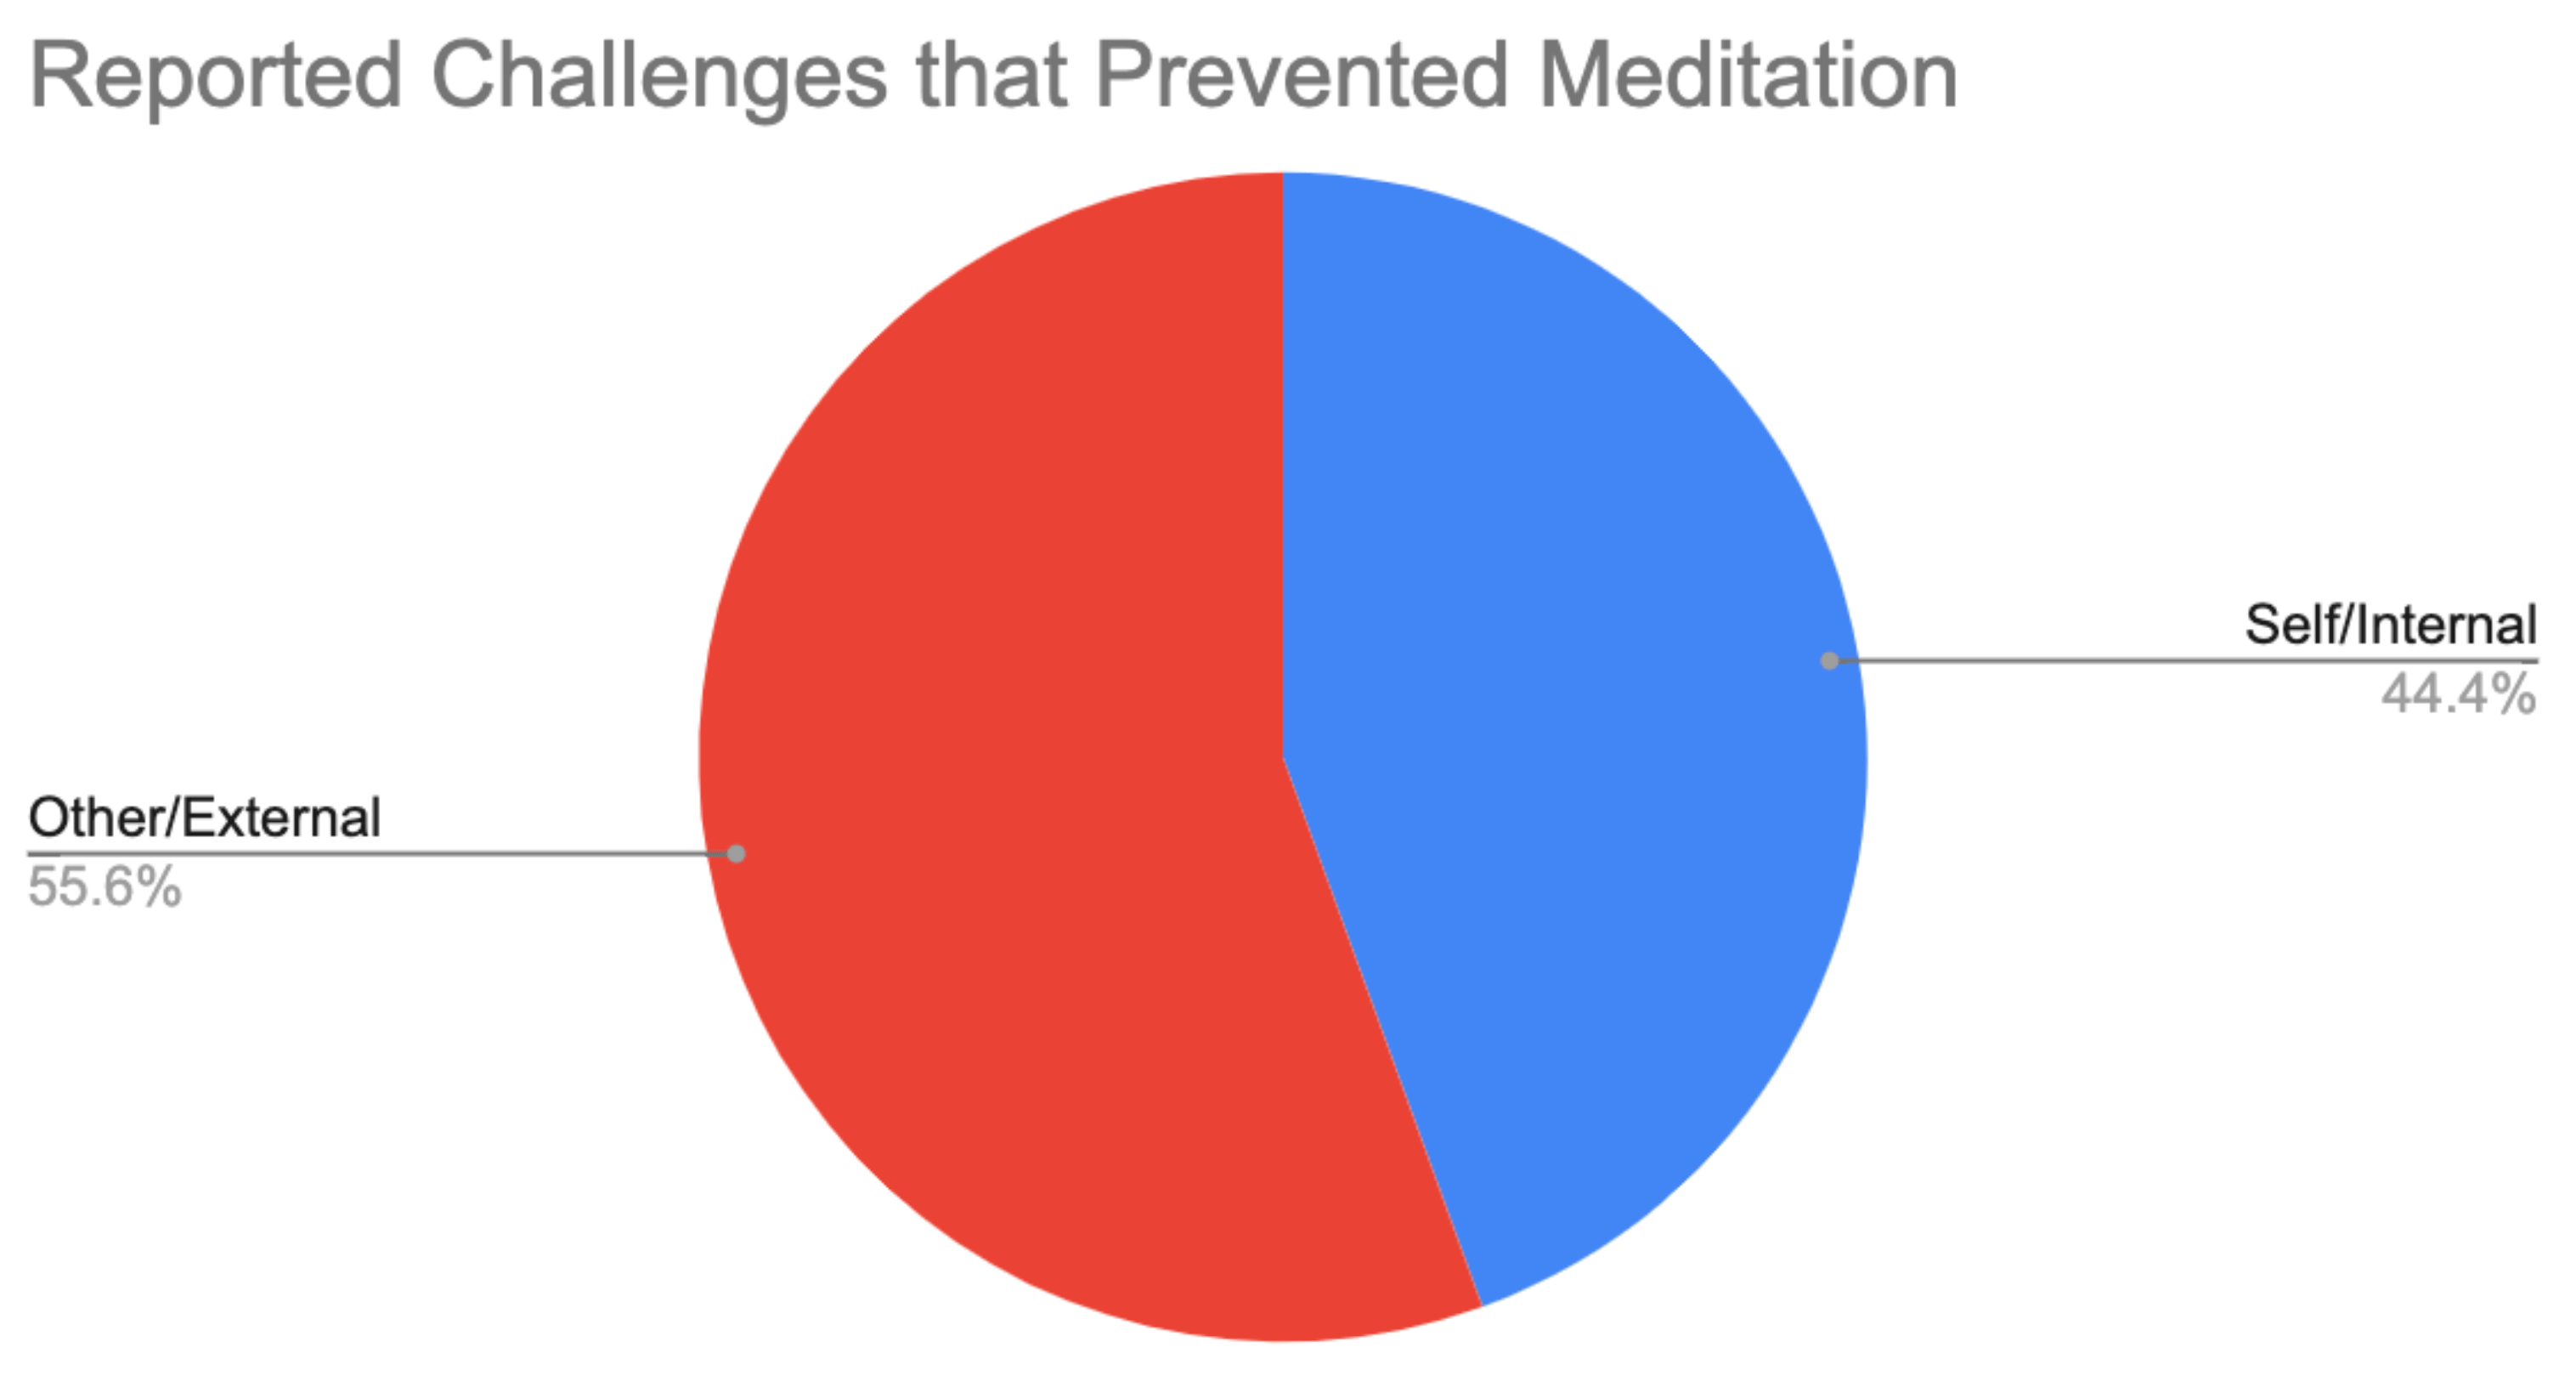
Sentiment analysis of participants’ open-ended qualitative responses from the diary study also helped us see their growing awareness of internal and external factors that prevented them from meditating on certain days (see Figure 10).
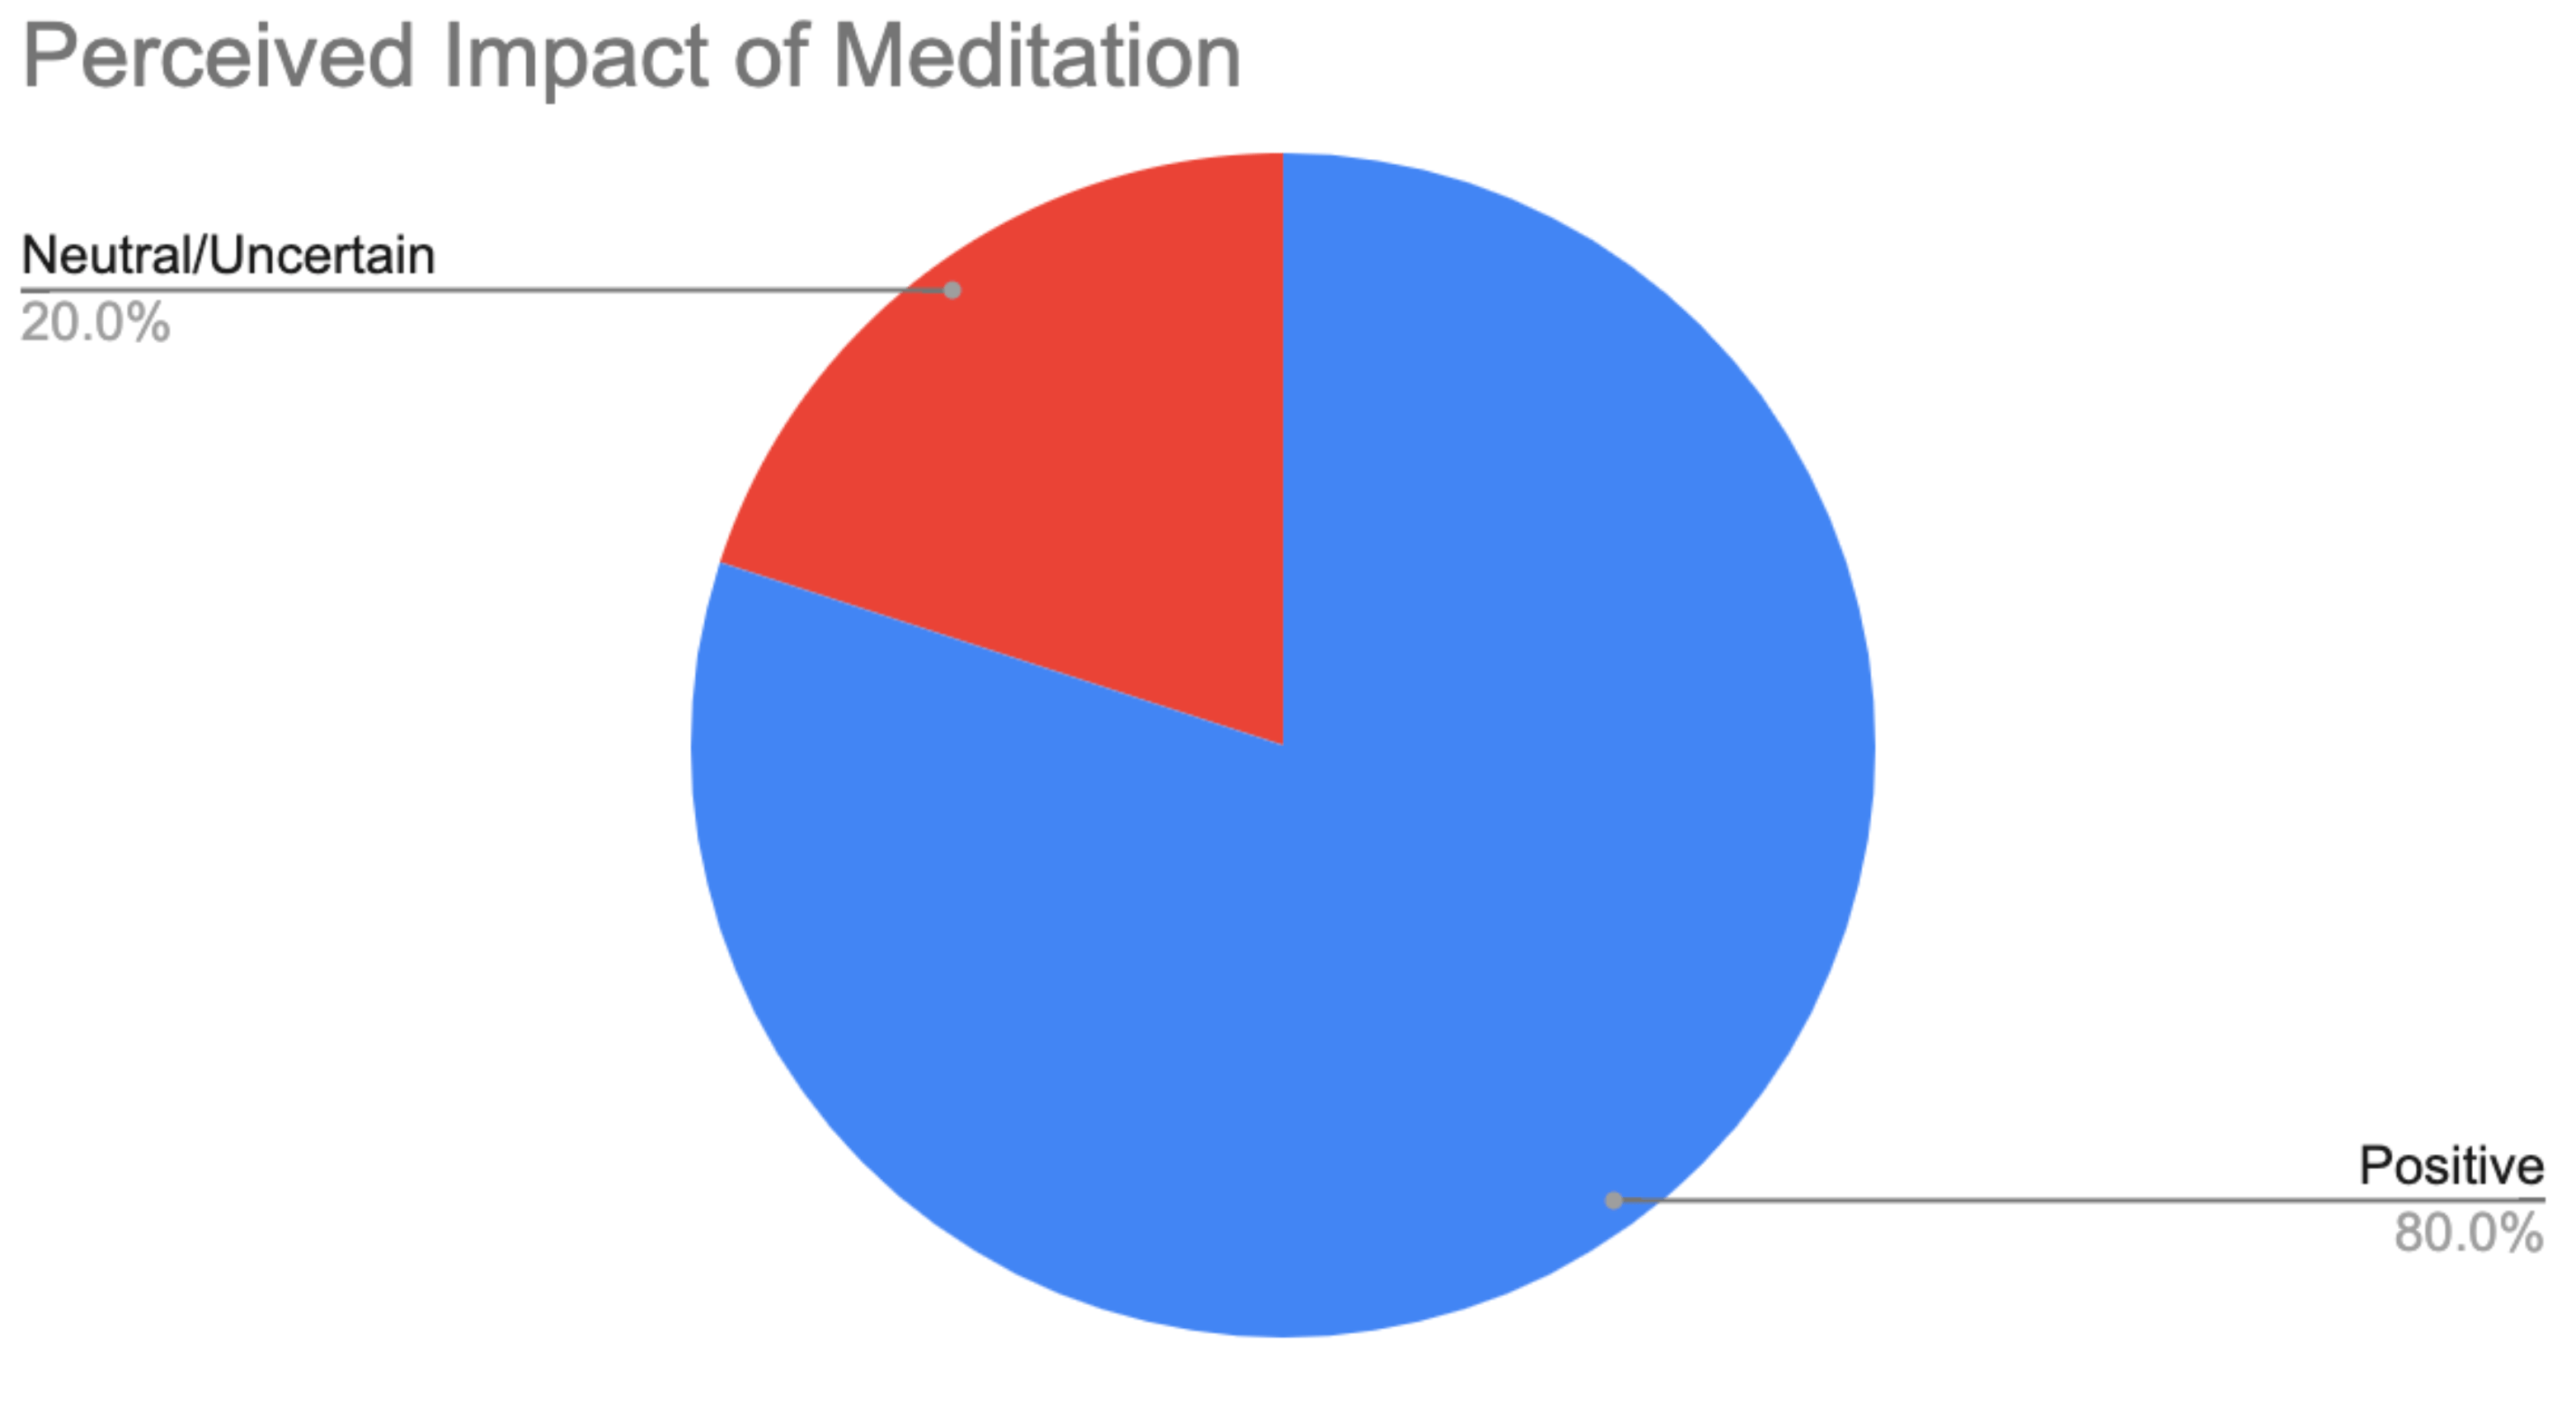
Additionally, their open-ended qualitative responses helped us see their perceived impact of each session, of which 80% of the sessions were rated as having a positive impact or 20 out of 25 sessions (see Figure 11).
Impact
Finally, our team shared a readout with stakeholders. We highlighted data from discovery interviews and rapid experiments to back up our recommendations for new meditation app features:
- Based on the increase of 9 average minutes spent meditating, we recommended adding a calendar synchronization feature between the app and the user’s personal calendar.
- Based on 80% of participants having positive perceptions of their meditation during the diary study, we recommended adding a journal feature that combines both quantitative and qualitative questions, and provides simple charts for user’s to track progress for session length and perceived impact.
